flowchart TD
    A[Define task] --> B[Data]
    B --> C[Train]
    C --> D[Val and Test]
    D --> C
    D --> E[Deploy]
Easy Image Classification
A 2-hour Masterclass · Theory, Code & Practical Demos
Sebastian Lopez-Marcano  — Data Science CRP, The University of Queensland
2026-05-06
Welcome
A ‘masterclass-style’ computer vision workshop (image classification)
We acknowledge the Traditional Owners of the lands on which we work and learn, and pay our respects to their Elders past, present and emerging.
What you’ll leave with
- A clear understanding of computer vision and its sub-tasks
- Confidence choosing between classification / detection / segmentation
- Practical understanding of training, validation, deployment
- Awareness of domain shift, transfer learning, foundational models, ensembles
- Python code gists you can adapt
- Short demos of Roboflow Notebooks + Roboflow Universe
- A direct line to the Data Science CRP for your own project
Ground rules
9 to ~11 am.
Tip
Ask as we go.
Note
Most of the theory will be paired with Python examples so you can see how the idea lands in practice.
My background and experience
- PhD in computer vision for fisheries monitoring
- Catlin Seaview Survey
- FishID Australia
- WildObs Australia
1 · Computer Vision
What is computer vision?
- Teaching computers to extract meaning from pixels
- Models learn spatial patterns inside an image (edges → textures → parts → objects)
- Modern computer vision is dominated by deep neural networks (CNNs, Vision Transformers)
 1
1
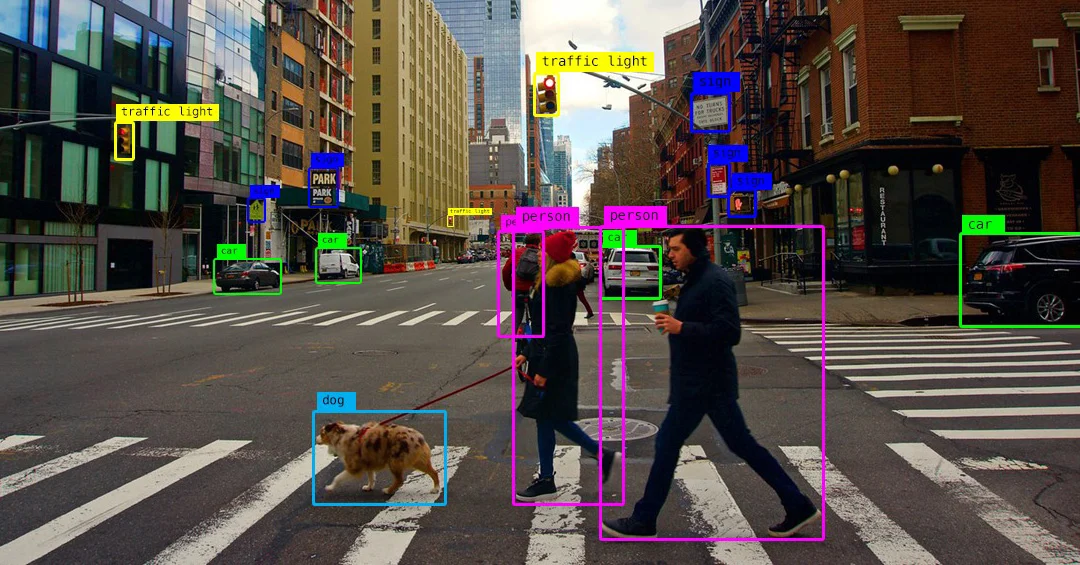
Computer vision applications
1
What is Roboflow
Roboflow is a platform for computer vision projects. It provides tools for:
- Data management — upload, annotate, version control
- Model training — pre-trained backbones, transfer learning, custom training loops
- Validation and Testing — metrics, confusion matrices, error analysis
- Deployment — hosted inference, API, edge deployment
Why use Roboflow?
There are many apps and tools that are making computer vision more accessible. From experience, Roboflow is the most comprehensive and user-friendly for end-to-end projects.
Warning
Some of the advanced features (e.g. hosted inference) are paid, but the free tier is generous enough for most research projects.
Warning
UQ or the Data Science CRP do not have any financial relationship with Roboflow. I just genuinely like their product and use it in my projects. Many people at UQ use it and have had good experiences.
The computer vision workflow
Other aspects of computer vision
Data High quality, labelled data is most important ‘asset’ in computer vision.
Compute AI is becoming more accessible, adding more pressure into processing infrastructure.
Models There are many pre-trained or foundation models you can already download.
You almost never need to train a model from scratch. Assume there is a pre-trained model that already does 70% of your job.
2 · Classification vs Detection vs Segmentation
The three core CV tasks
There are three core CV tasks that cover most use cases. They differ in the specificity of their output.
| Task | Output | Answers | Typical use |
|---|---|---|---|
| Classification | One (or many) labels per image | What is in this image? | Species ID, quality control |
| Object detection | Labels + bounding boxes | What and where? | Counting, tracking, surveillance |
| Segmentation | Per-pixel labels (mask) | What, where, exact shape? | Medical imaging, area/biomass |
Warning
Cost scales with task type. Segmentation tasks are more expensive than classification tasks.
Visual examples
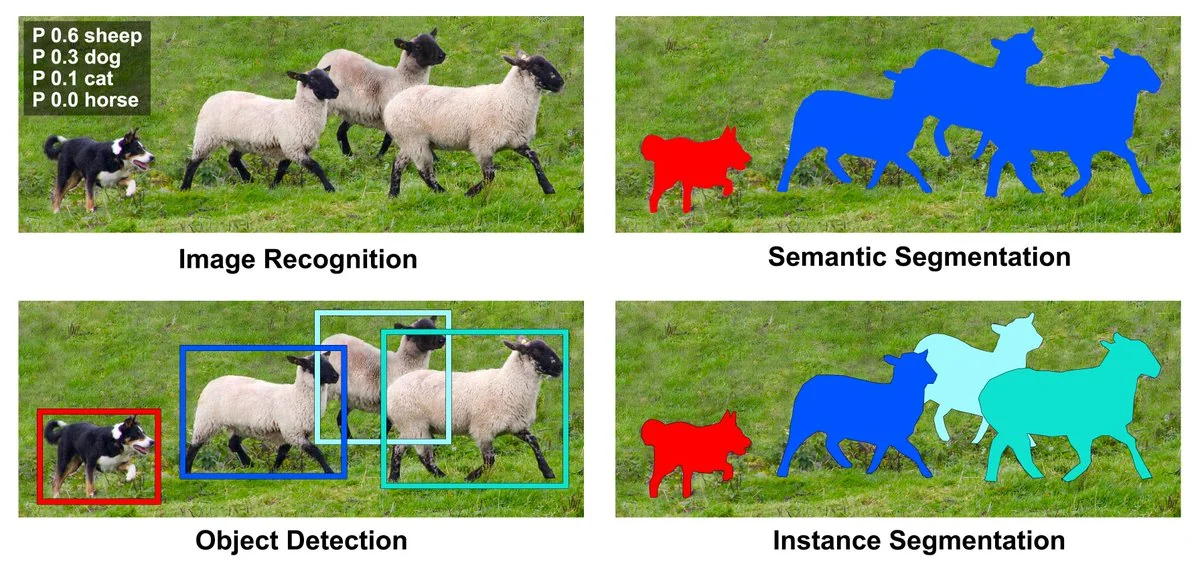
1
Visual examples (cont.)
This is how the model ‘sees’ the data and what it learns to output for each task. The conf scores are the model’s confidence in its prediction. More information on this in the validation and testing section.
Classification
{label: 'cat', conf: 0.94}
Detection
[{label:'cat', bbox:[x1,y1,x2,y2], conf:0.91}]
Segmentation
mask: ndarray[H,W] of class ids
Code: three tasks, three one-liners (Roboflow)
Roboflow has several python libraries to make it easy to pull pre-trained models and run inference on your images. In here we show how to use inference.
from inference import get_model

# --- Classification — cell type from microscopy image ---
cls   = get_model("cell-type-classifier/1").infer("slide.jpg")[0]

# --- Detection — locate nuclei with bounding boxes ---
dets  = get_model("nuclei-detection/2").infer("slide.jpg")[0]

# --- Segmentation — pixel-level cell masks via SAM 2 ---
masks = get_model("sam2/hiera_small").infer("slide.jpg")[0]
Note
get_model("owner/version") pulls any model from Roboflow Universe (more info on this later)
Which task for which question?
Start from the decision you want to make; work out the minimum output that enables it.
| Domain | Question | Task |
|---|---|---|
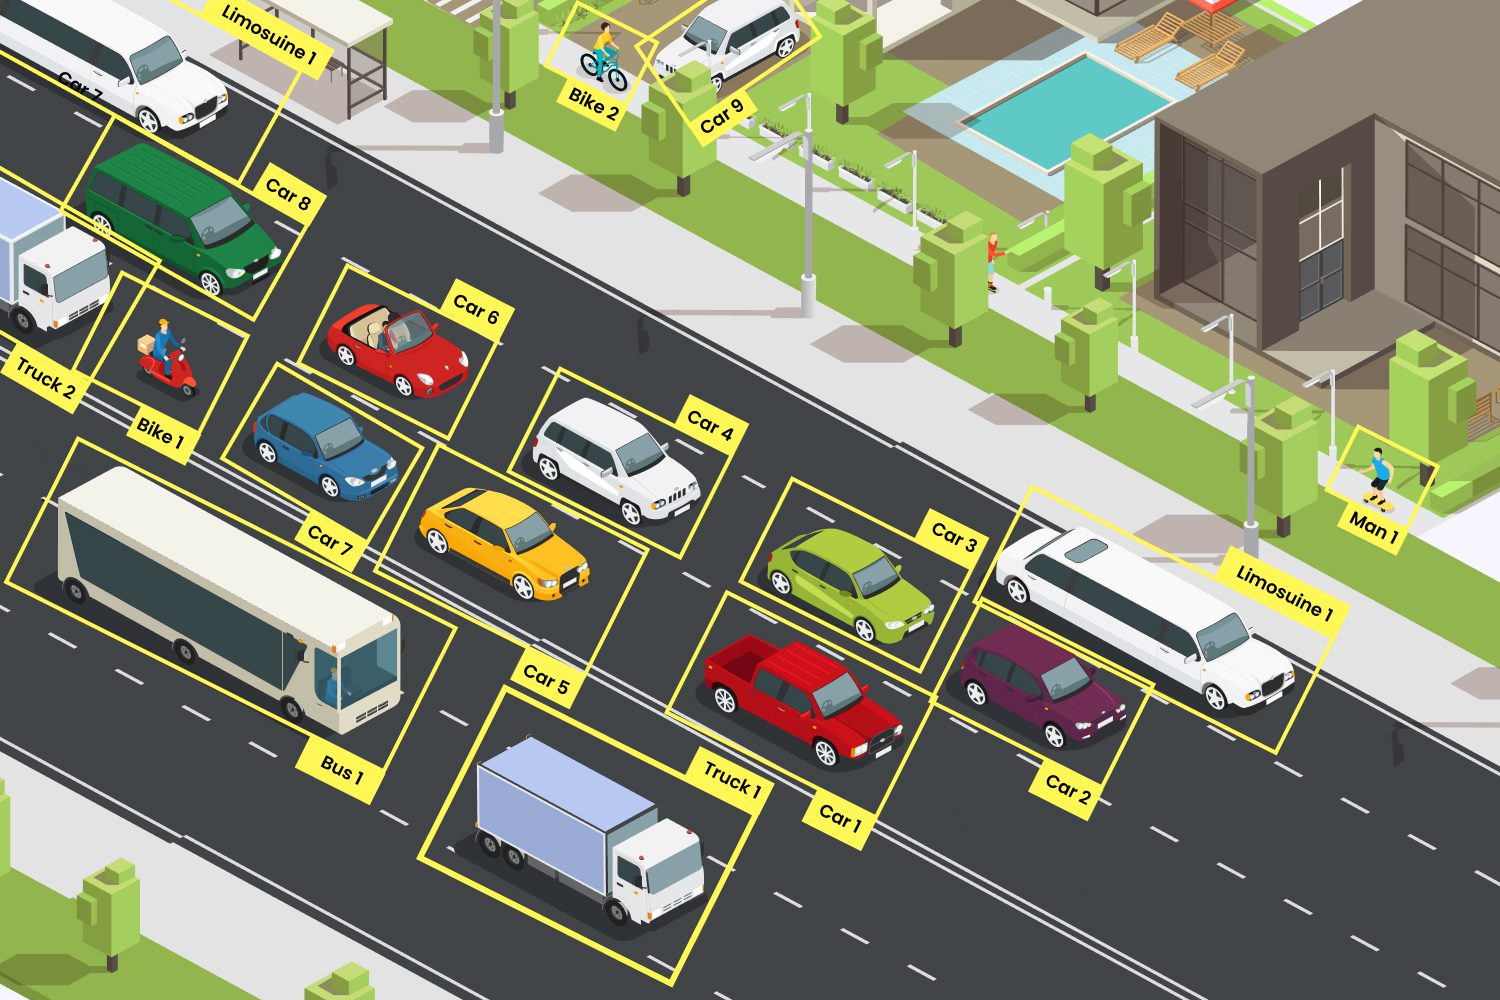
| Traffic | Is this vehicle a car, bus, or truck? | Classification |
| Microscopy (health) | How many nuclei are in this slide? | Detection |
| Agriculture | What fraction of the canopy is affected by disease? | Segmentation |
3 · Collecting & Labelling Data
flowchart TD
    A["Define task ✅"] --> B[Data]
    B --> C[Train]
    C --> D[Val and Test]
    D --> C
    D --> E[Deploy]
The data-centric mindset
Data is the foundation of computer vision. A better dataset beats a better model every time.
1
Moving away from manual labelling
In the early days of computer vision, labelling was a purely manual process. Now we can leverage semi-automated labelling techniques to speed up the annotation process.
For example we can ask ‘foundational models’ like ‘CLIP’ or ‘SAM’ to find and label your object of interest in an image.
Important
In some situations manual labelling is still necessary - for those highly domain-specific tasks where pre-trained models struggle.
General examples of manual vs automated labelling
| Manual labelling | Semi-automated labelling |
|---|---|
| Detecting coral bleaching in a location where AI has never been trained before | Detect coral reefs and classify it into species / genus |
| Classifying plant diseases from leaf images | Segment parts of a plant (leaf, trunk, fruit etc) |
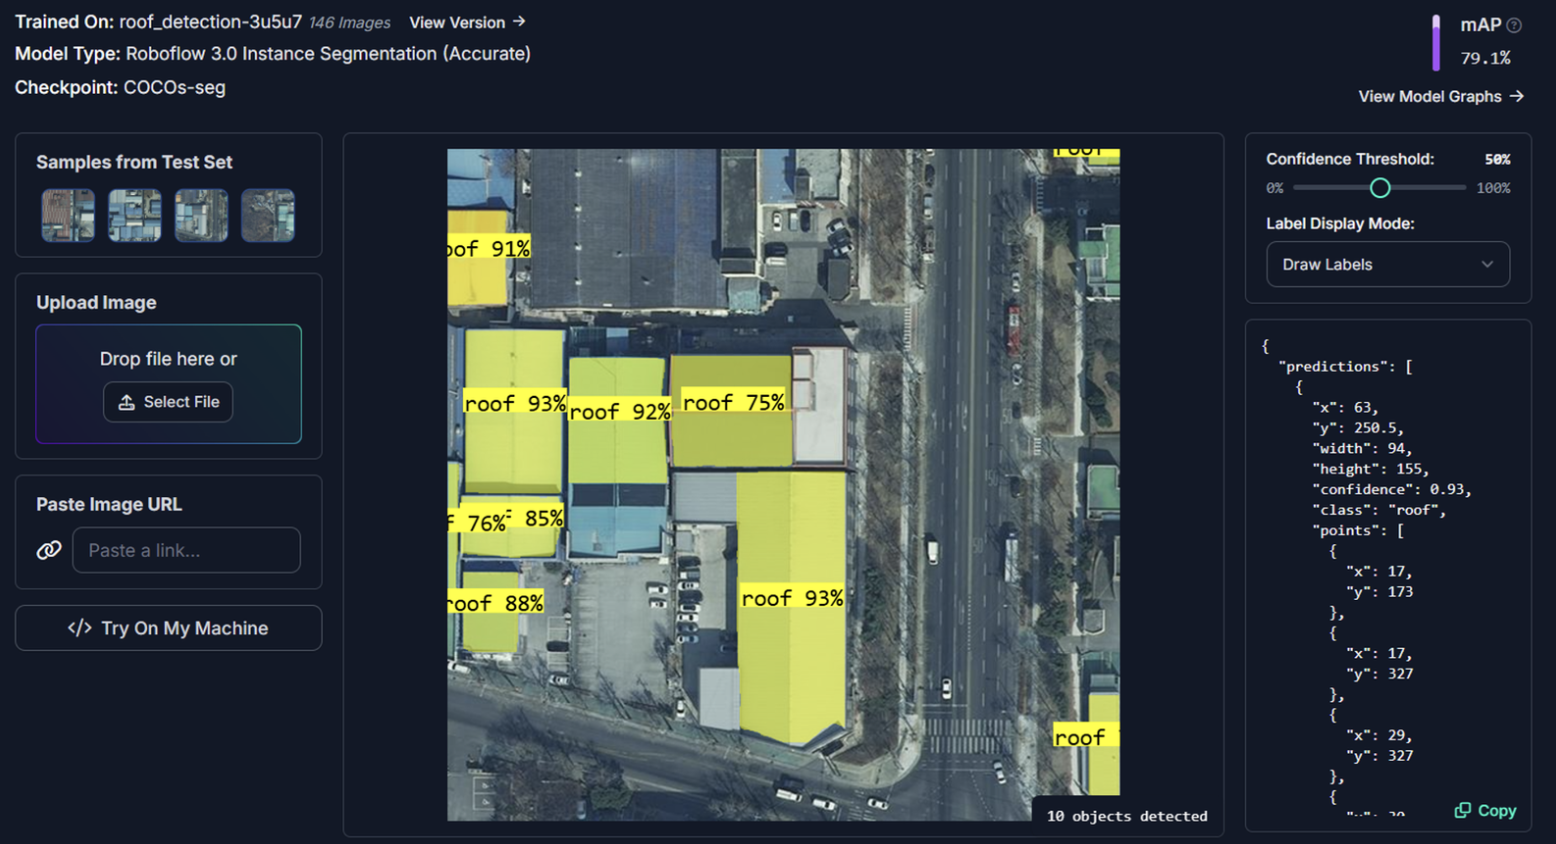
‘Rapid’ in Roboflow
Semi-automated labelling in action
1
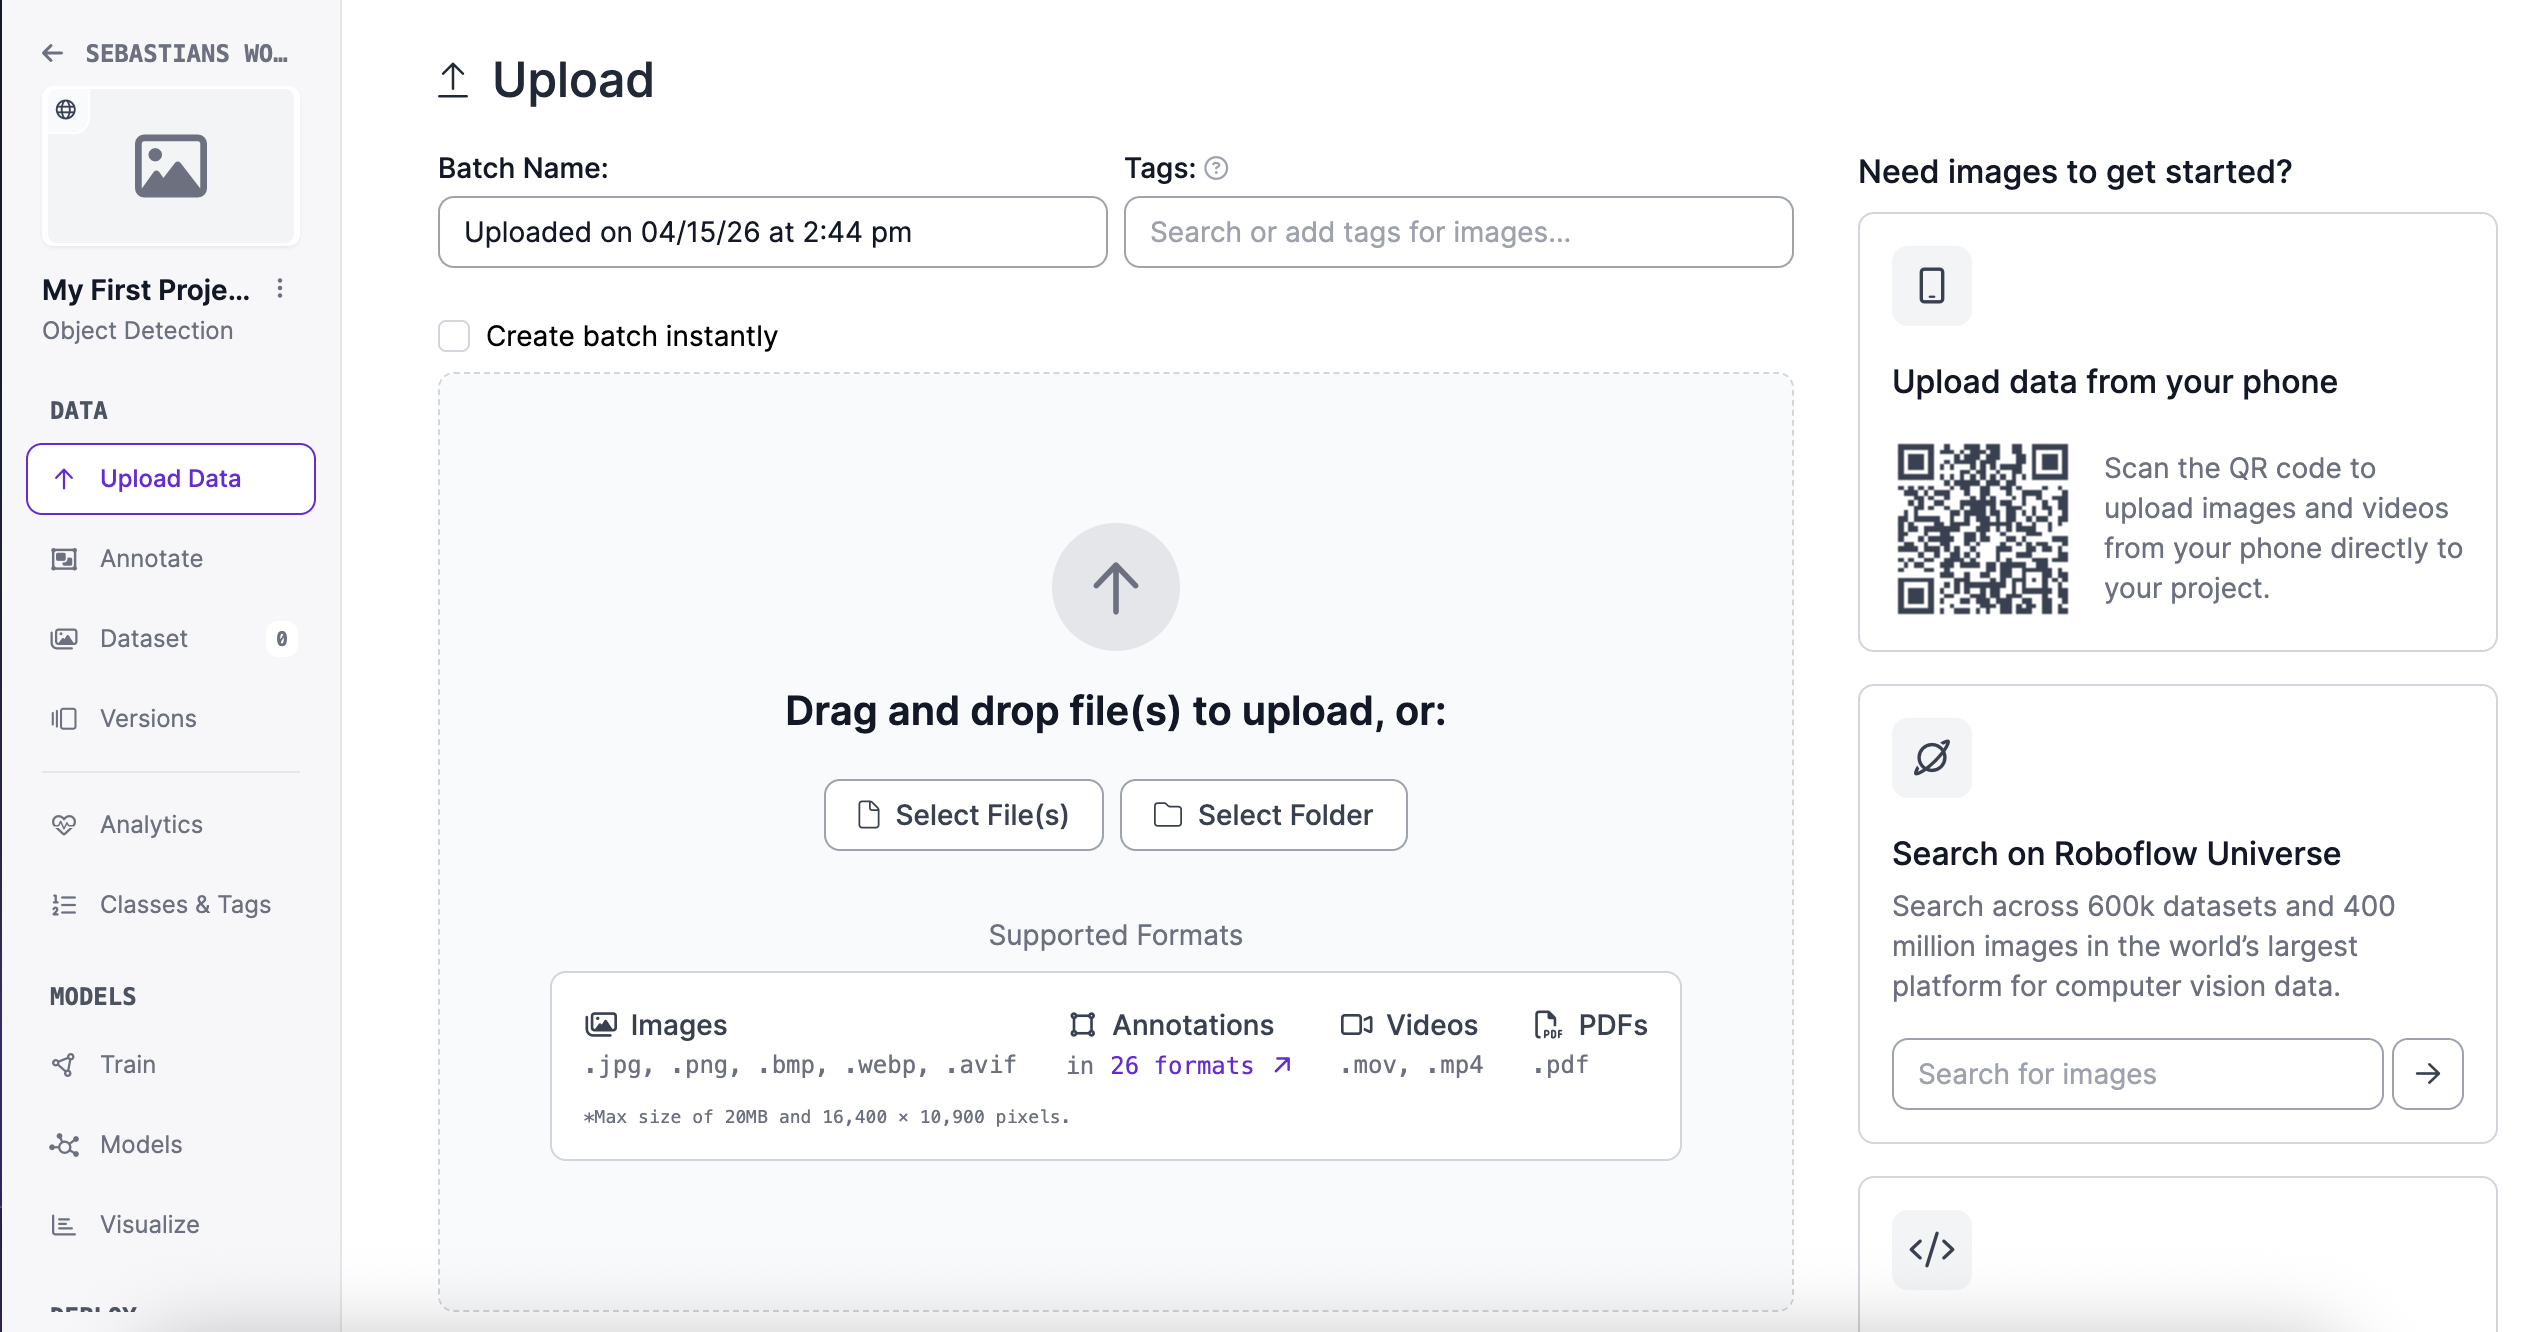
Other cool features in Roboflow (re to data collection & labelling)
- You can upload and annotate data collected ‘live’ in your mobile
- Accepts images, videos, pdfs, etc
Uploading data in Roboflow
1
Roboflow Universe: pre-labelled datasets & pre-trained models
Roboflow Universe is a public repository of datasets and models. You can search for a dataset/model that matches your problem, and either use it directly or fine-tune it on your data.
- 💡Lets have a quick look at the website and see what’s there - Roboflow Universe
How do you use a dataset or model from Roboflow Universe?
3 · Training, Validation & Testing
flowchart TD
    A["Define task ✅"] --> B["Data✅"]
    B --> C[Train]
    C --> D[Val and Test]
    D --> C
    D --> E[Deploy]
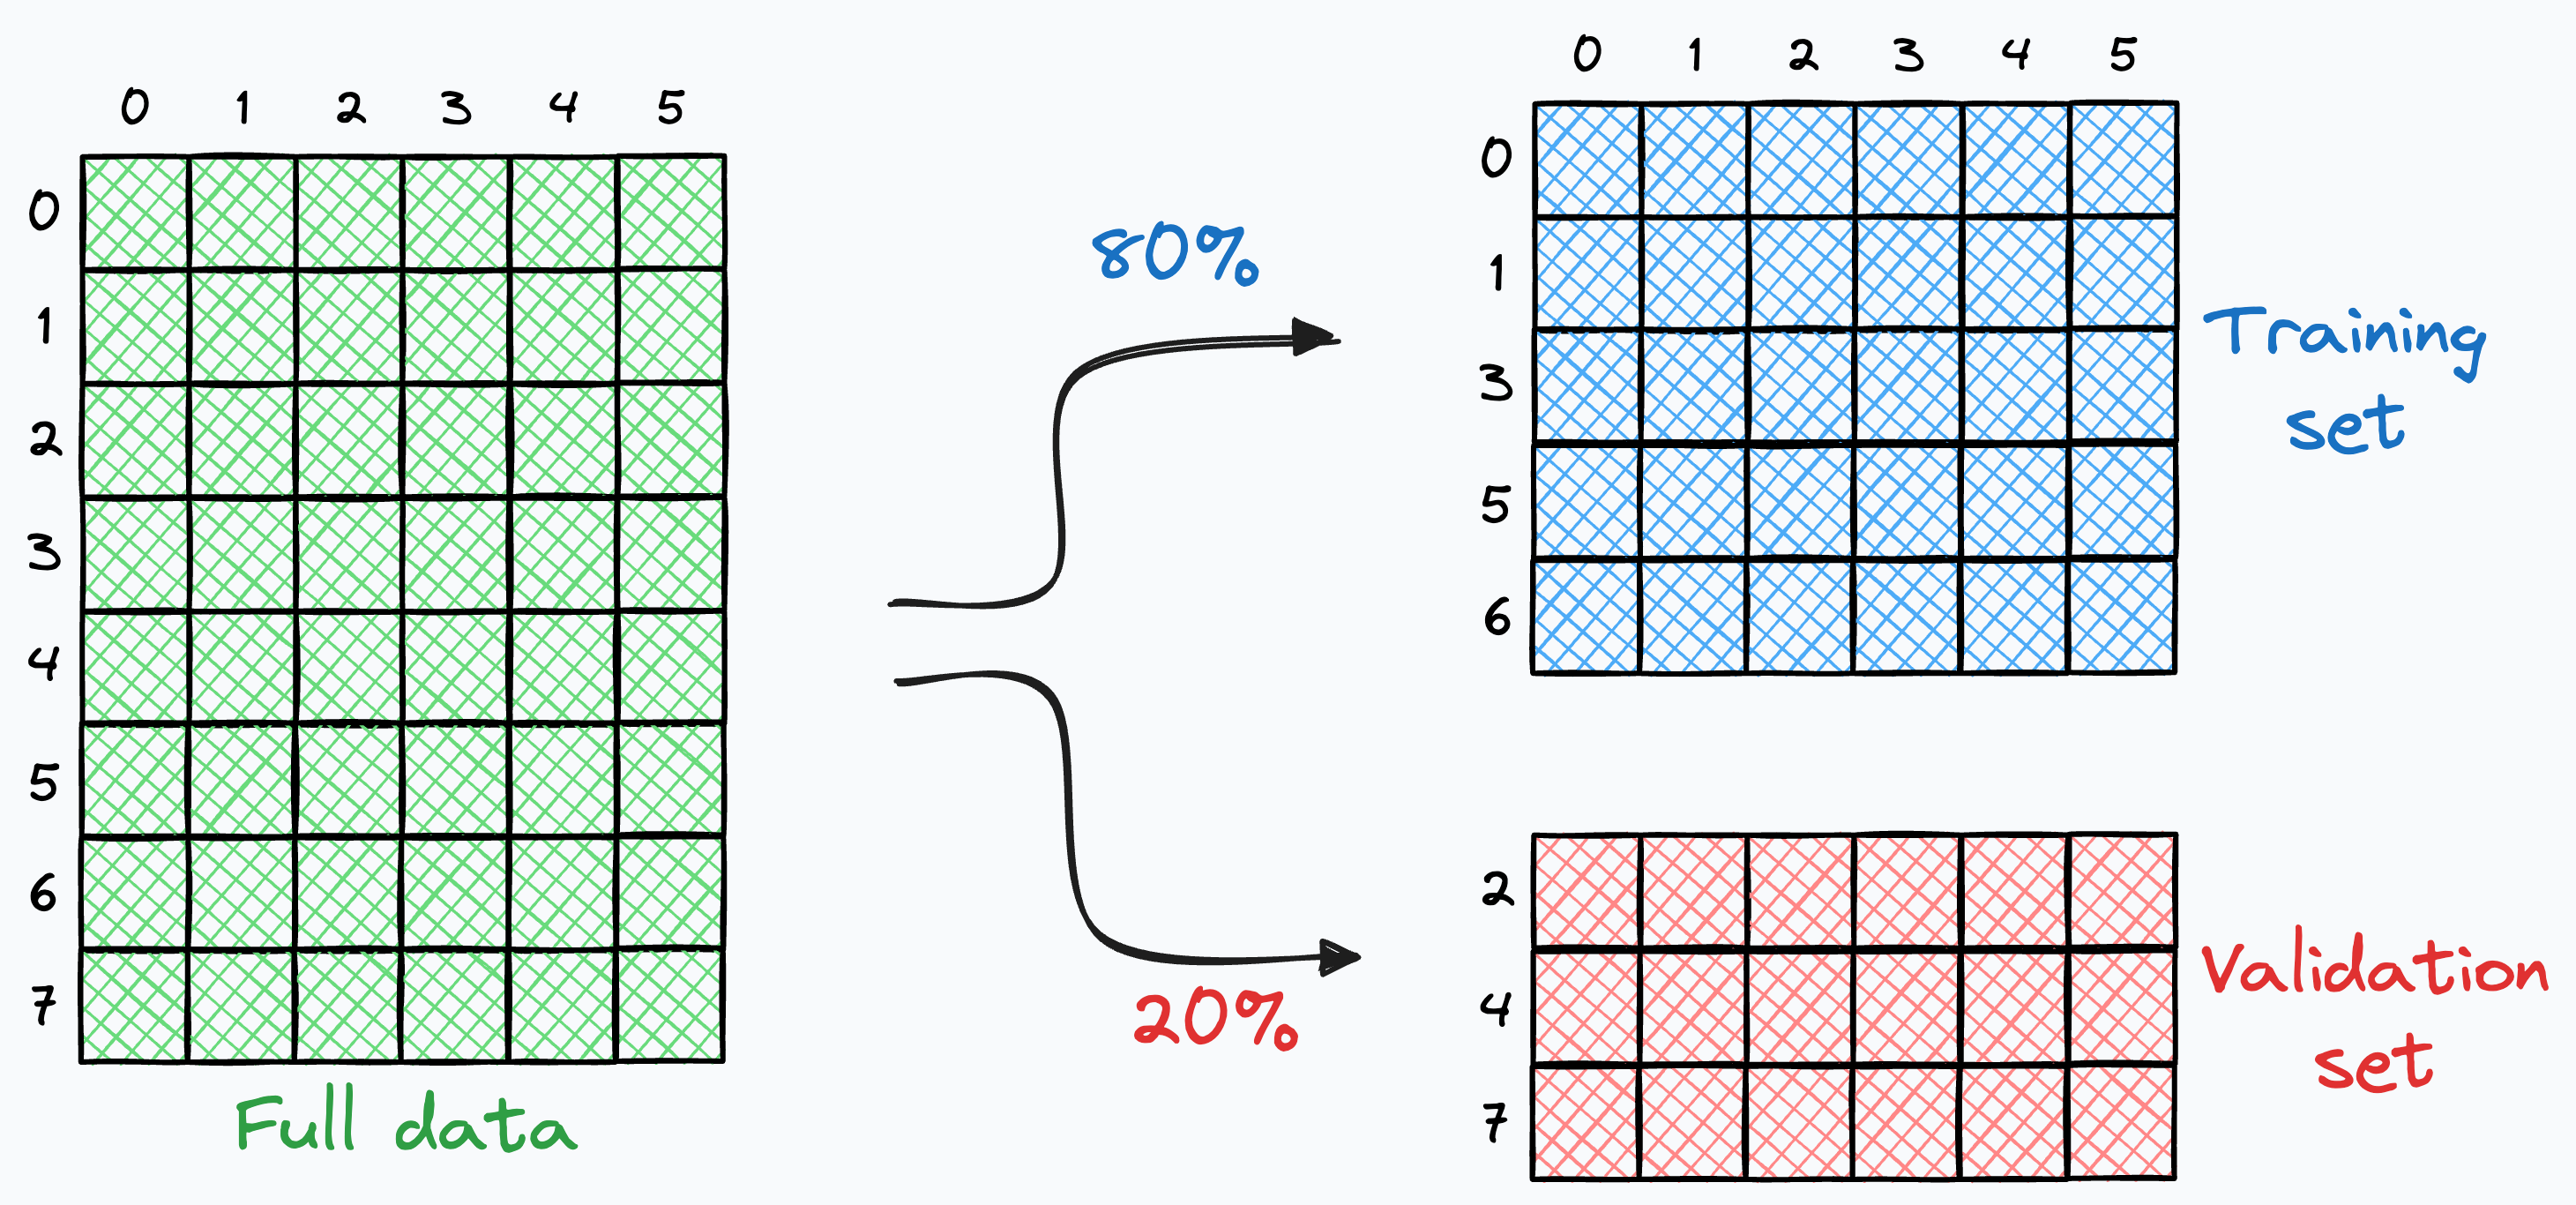
The three-split doctrine
Once you have labelled data you need to split the data into three sets: Train, Validation, and Test. Each set has a specific purpose in the model development lifecycle.
flowchart LR
    D[Labelled data] --> T[Train ~70%]
    D --> V[Val ~15%]
    D --> S[Test ~15%]
    T -->|fit weights| M[Model]
    V -->|tune hyperparams| M
    S -->|final metric| R[Final result]
Important
The test set is sacred. Use it when you are ready to test / report your final results.
How to select data for each split?
- Random split — simple and easy to do but problematic if there are correlations (e.g. same site, date, camera)
- Stratified split — ensures labelled data is balanced in each set, but difficult to apply if you have many classes
- Training
- 100 images for disease A
- 100 images for disease B
- Validation
- 20 images for disease A
- 20 images for disease B
- Training
Data splitting
Adding variability to your splits
Models only learn from the data you show them. If your training set is too narrow, your model will fail when it sees something new in the real world.
Warning
This is one of the most common sources of “it worked in the lab but fails in the field” problems.
How to actually train a model?
There are many frameworks and libraries to train models, but here is classic object detection example
from roboflow import Roboflow
from ultralytics import YOLO
import supervision as sv

# 1. pull dataset
dataset = Roboflow(api_key="YOUR_KEY") \
    .workspace("my-workspace") \
    .project("my-detection-project") \
    .version(1).download("yolov8")

# 2. train
model = YOLO("yolov8n.pt")
model.train(data=f"{dataset.location}/data.yaml", epochs=30, imgsz=640)
How to actually train a model? (cont.)
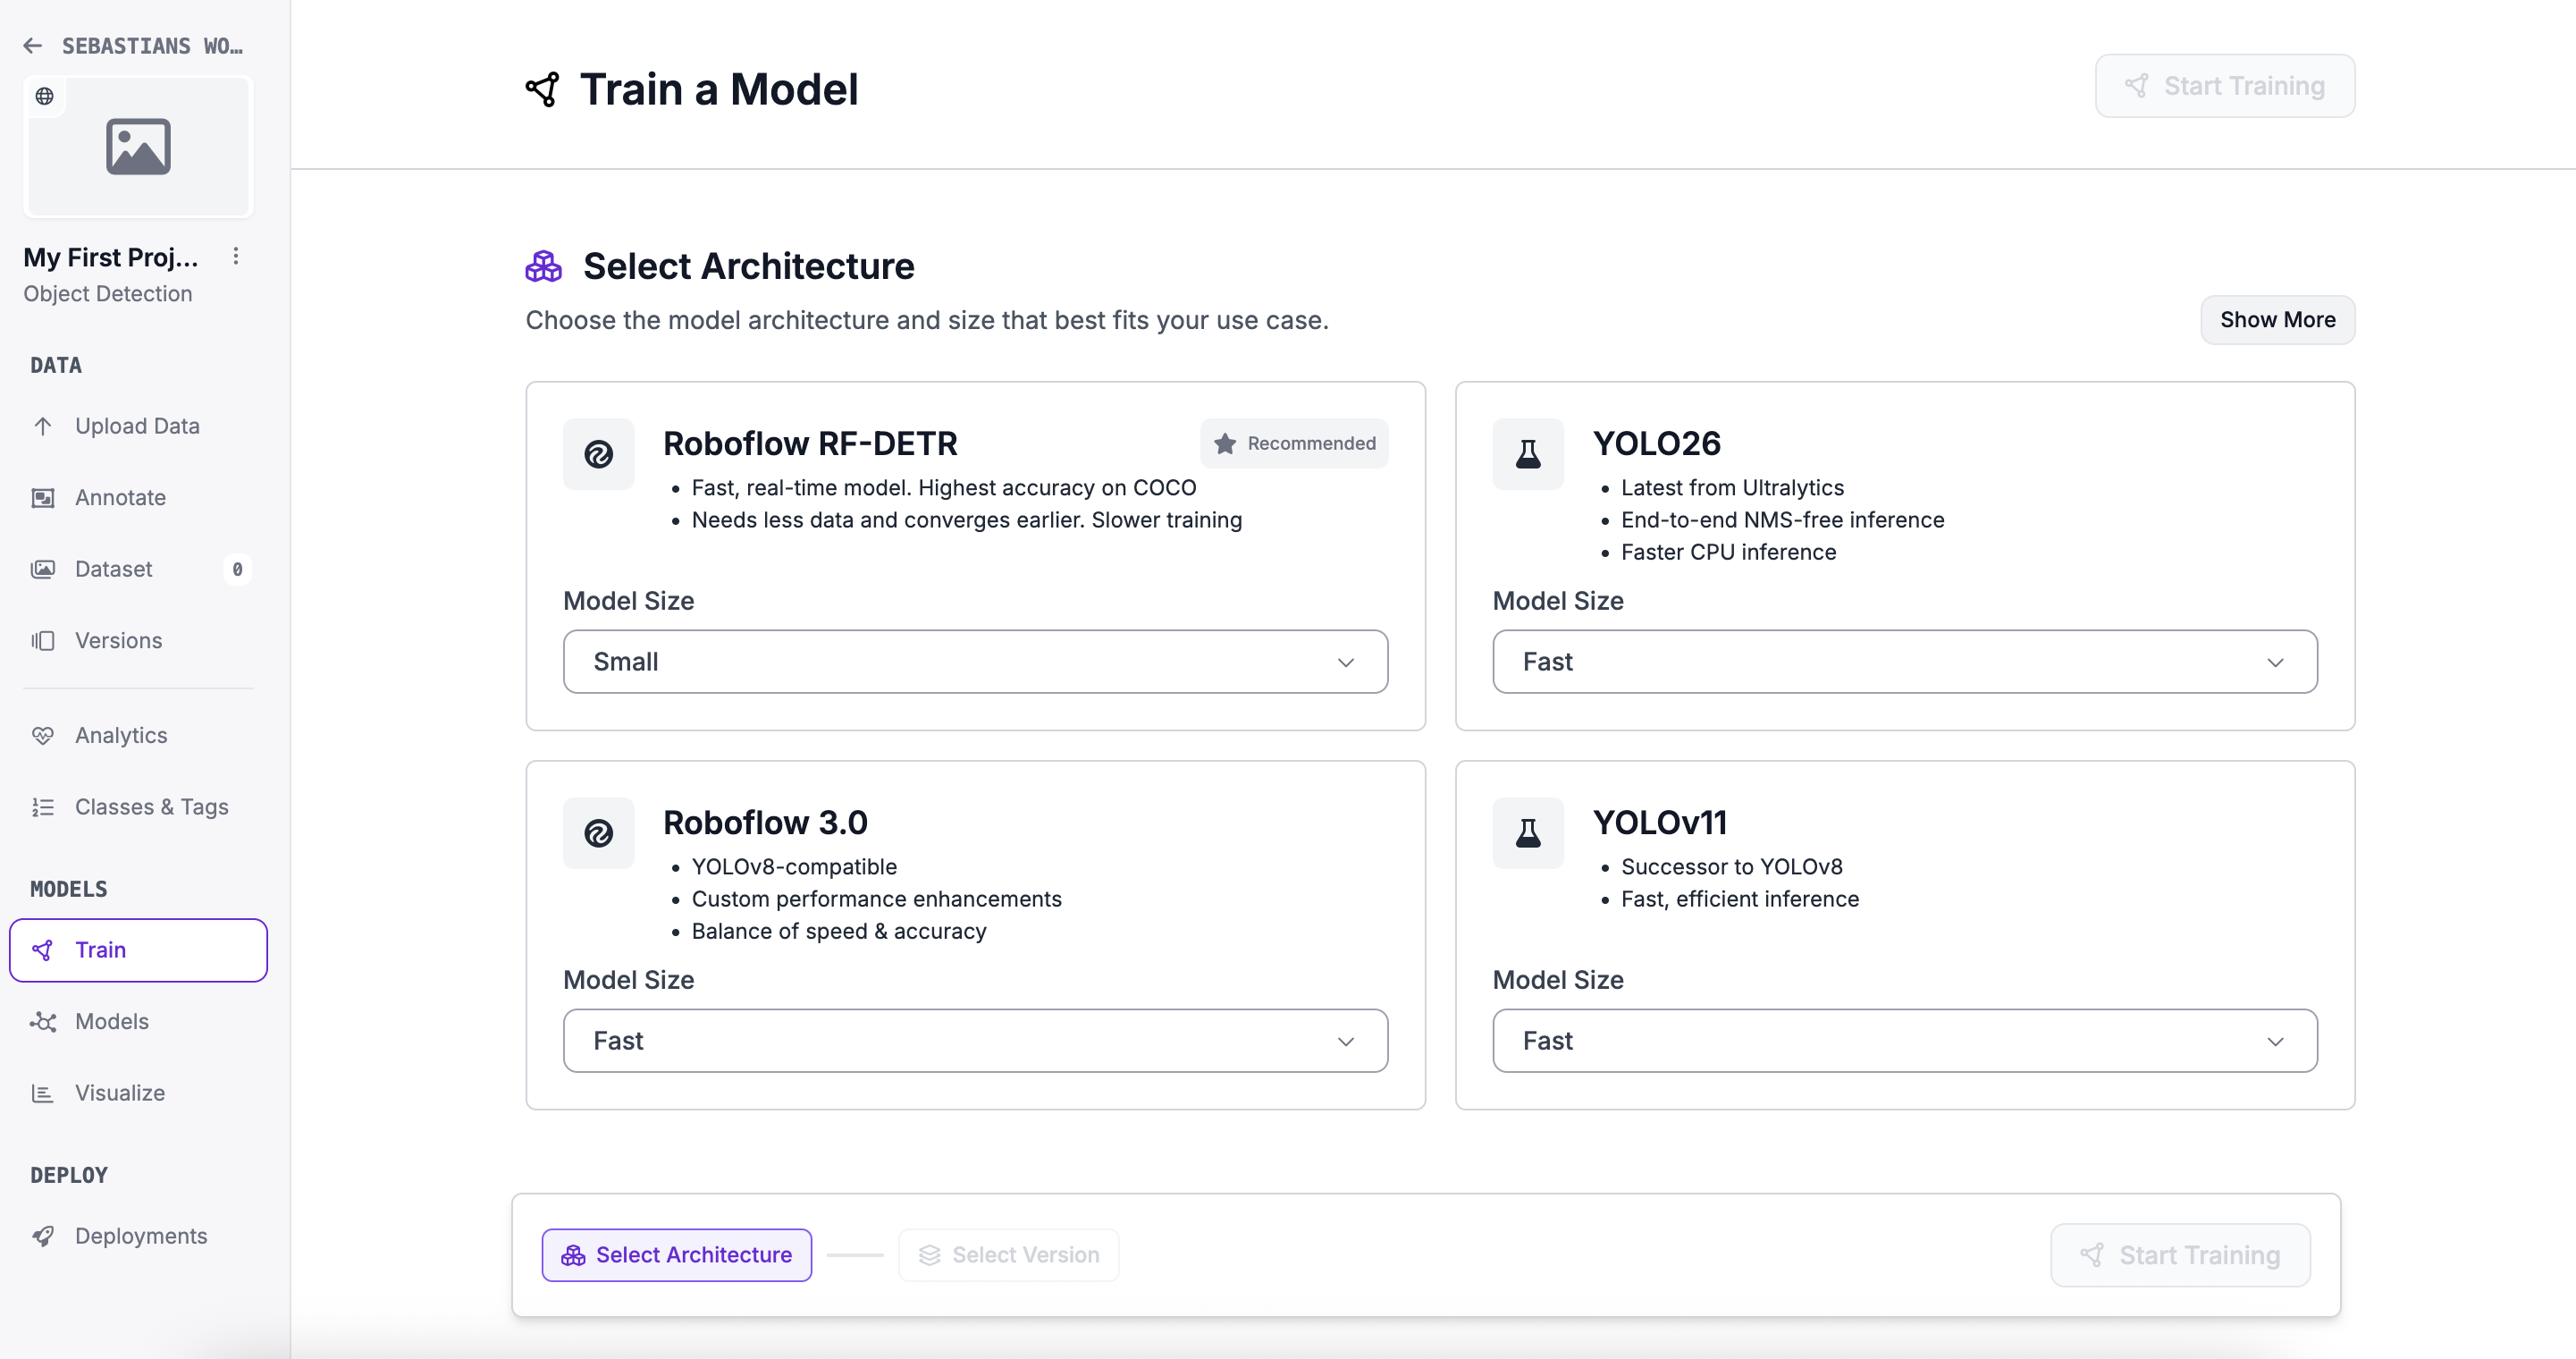
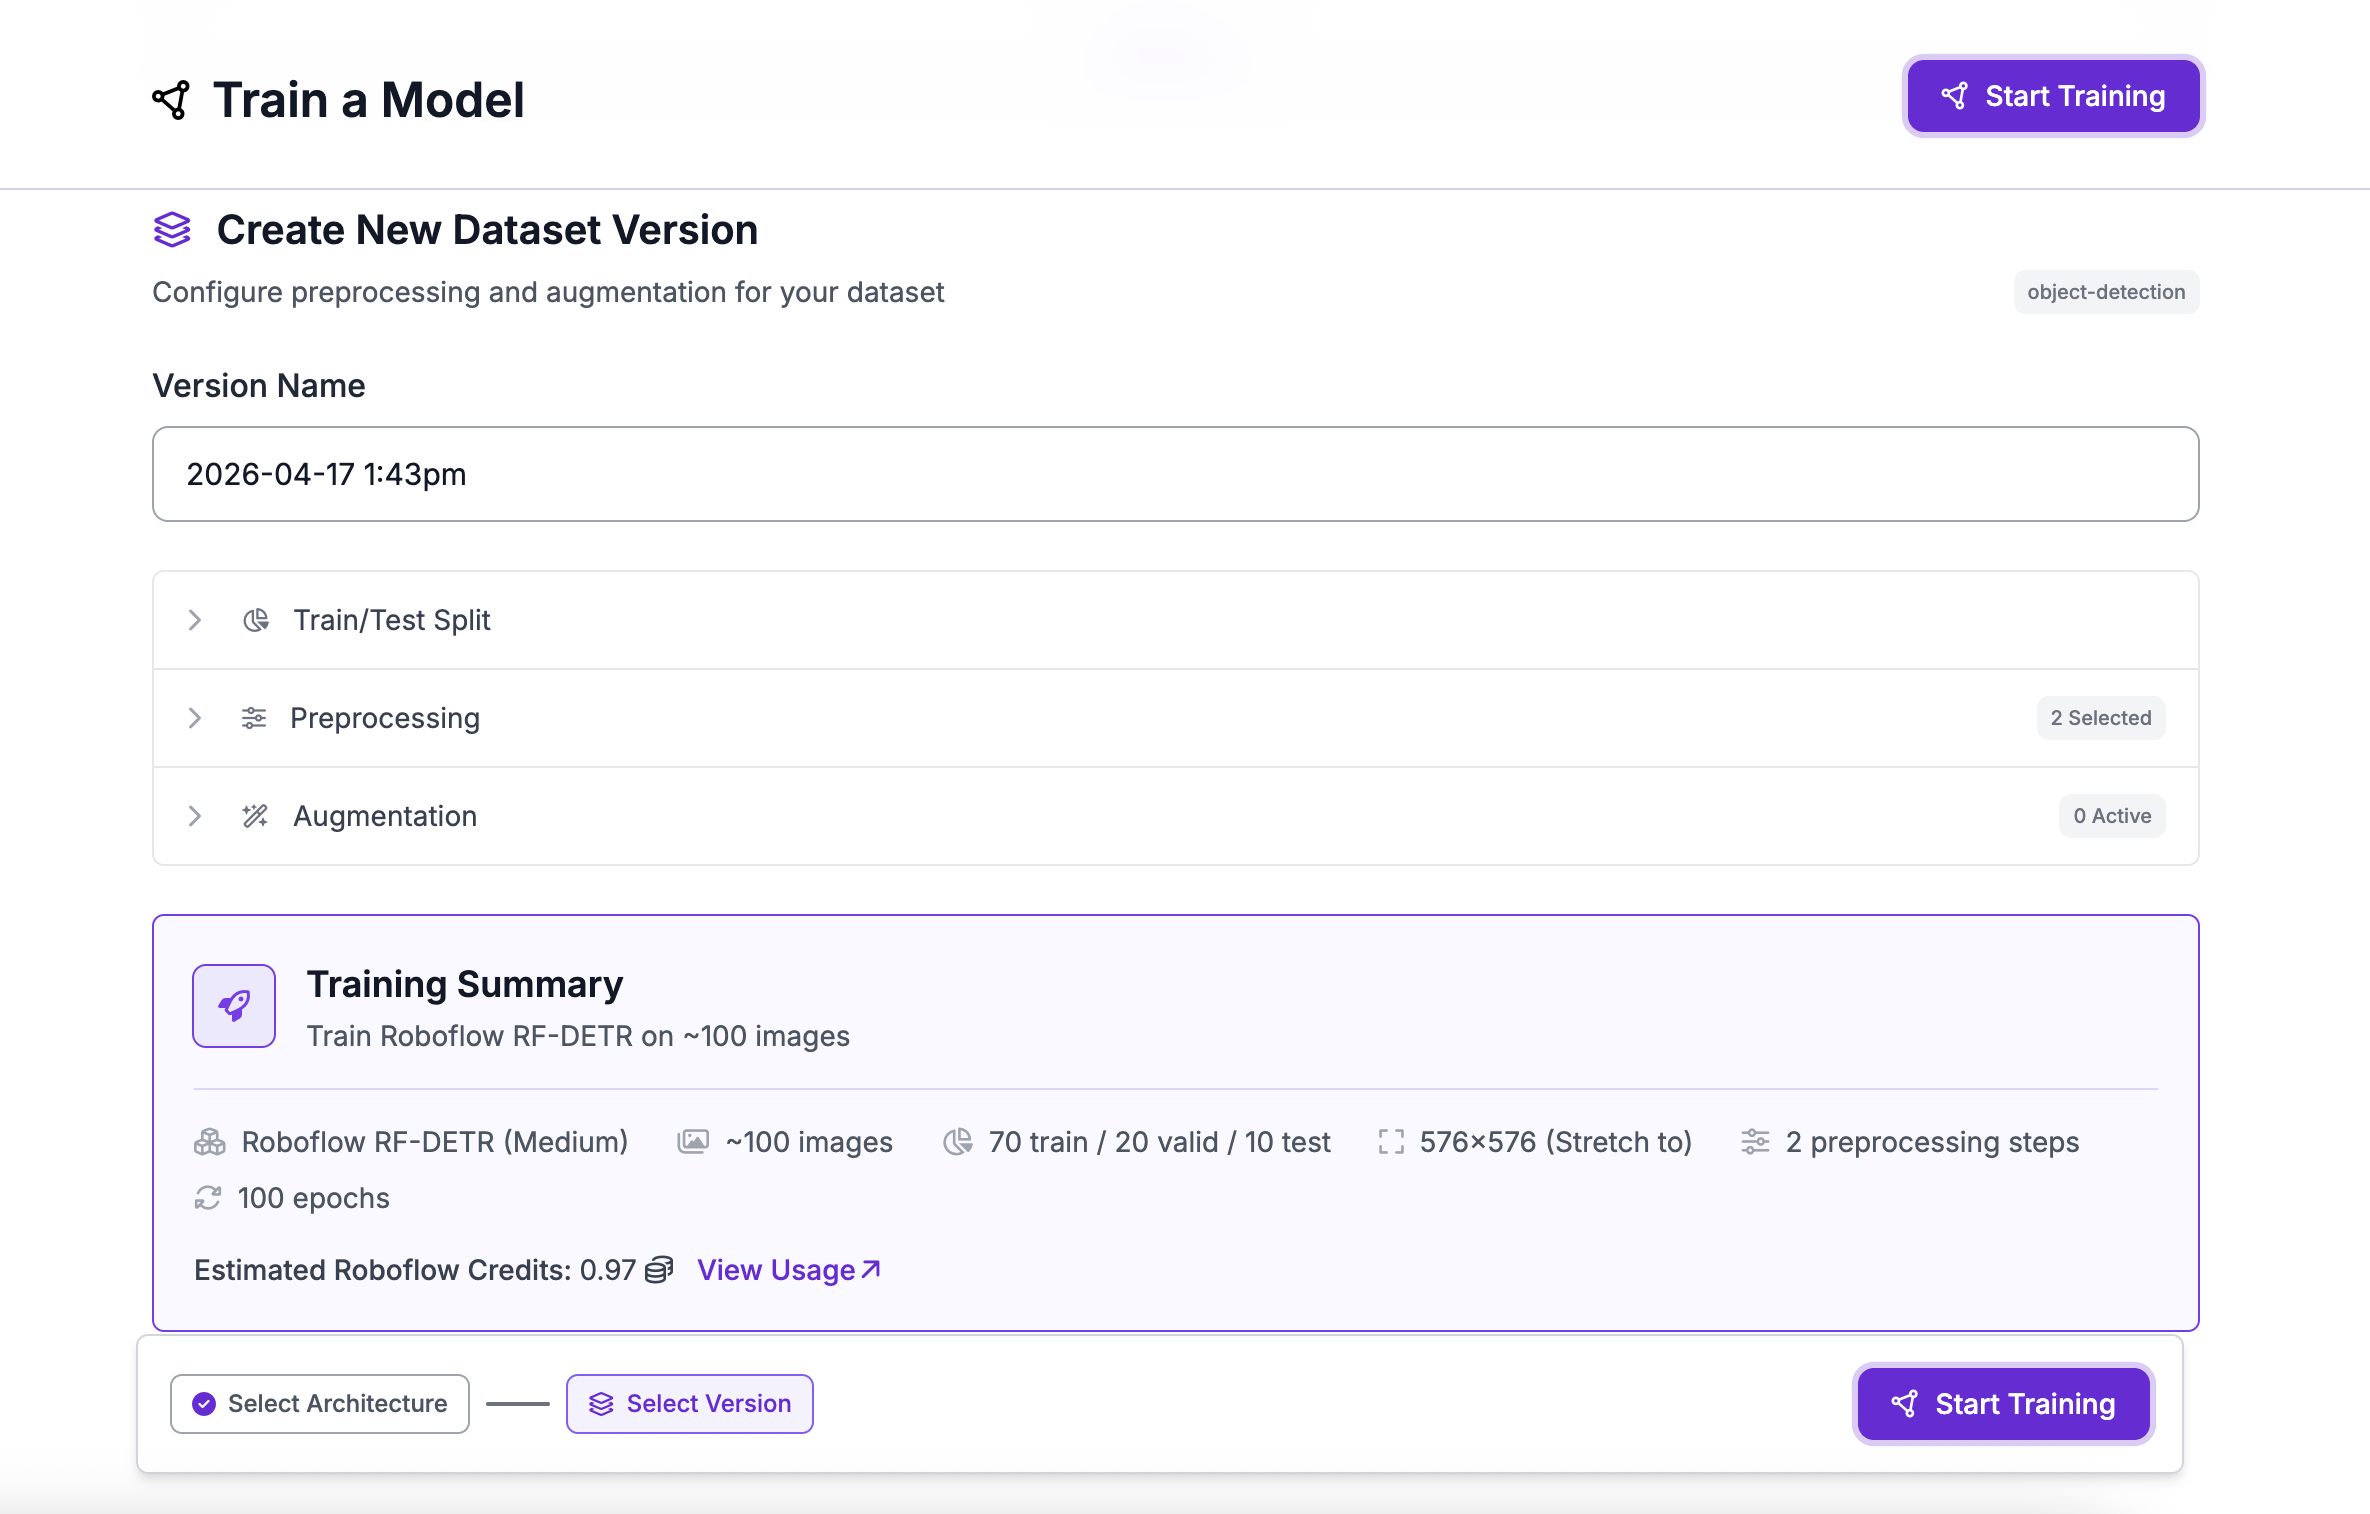
In Roboflow, its all point and click tools. Plenty of options, tutorials and code (if you want to do it yourself).
Training a model in Roboflow Part 1
 1
1
Training a model in Roboflow Part 2
 1
1
Training a model in Roboflow Part 3
 1
1
A quick overview of model frameworks
| # | Model | Type | Strengths | Best For |
|---|---|---|---|---|
| 🥇 | YOLO26 | Detection / Multi-task | Fastest edge inference, NMS-free, multi-task | IoT, robotics, real-time apps |
| 🥈 | YOLOv12 | Detection | Best accuracy, attention-centric | Research & benchmarking |
| 🥉 | RF-DETR | Detection / Segmentation | Best cross-domain generalisation | Medical, infrastructure |
| 4 | OpenCV | Classical CV | No ML needed, rock-solid preprocessing | Pipelines, rule-based vision |
| 5 | SAM 2 | Segmentation | Zero-shot, no labels needed | Healthcare, geospatial |
How to interpret evaluation and testing results?
 1
1
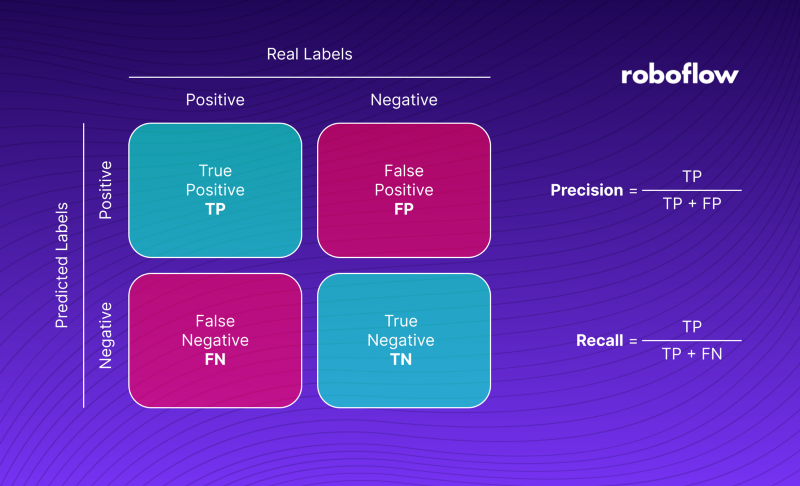
Precision, recall and F1
- Precision: Of all the positive predictions, how many were correct? (TP / (TP + FP))
- Is the model making a lot of false positives? (e.g. detecting disease when there is none)
- Recall: Of all the actual positives, how many did we correctly identify? (TP / (TP + FN))
- Is the model missing a lot of true cases? (e.g. failing to detect disease when it is present)
- F1 Score: The harmonic mean of precision and recall. It balances the two metrics. (2 * (Precision * Recall) / (Precision + Recall))
- Useful when you want a single metric to evaluate model performance.
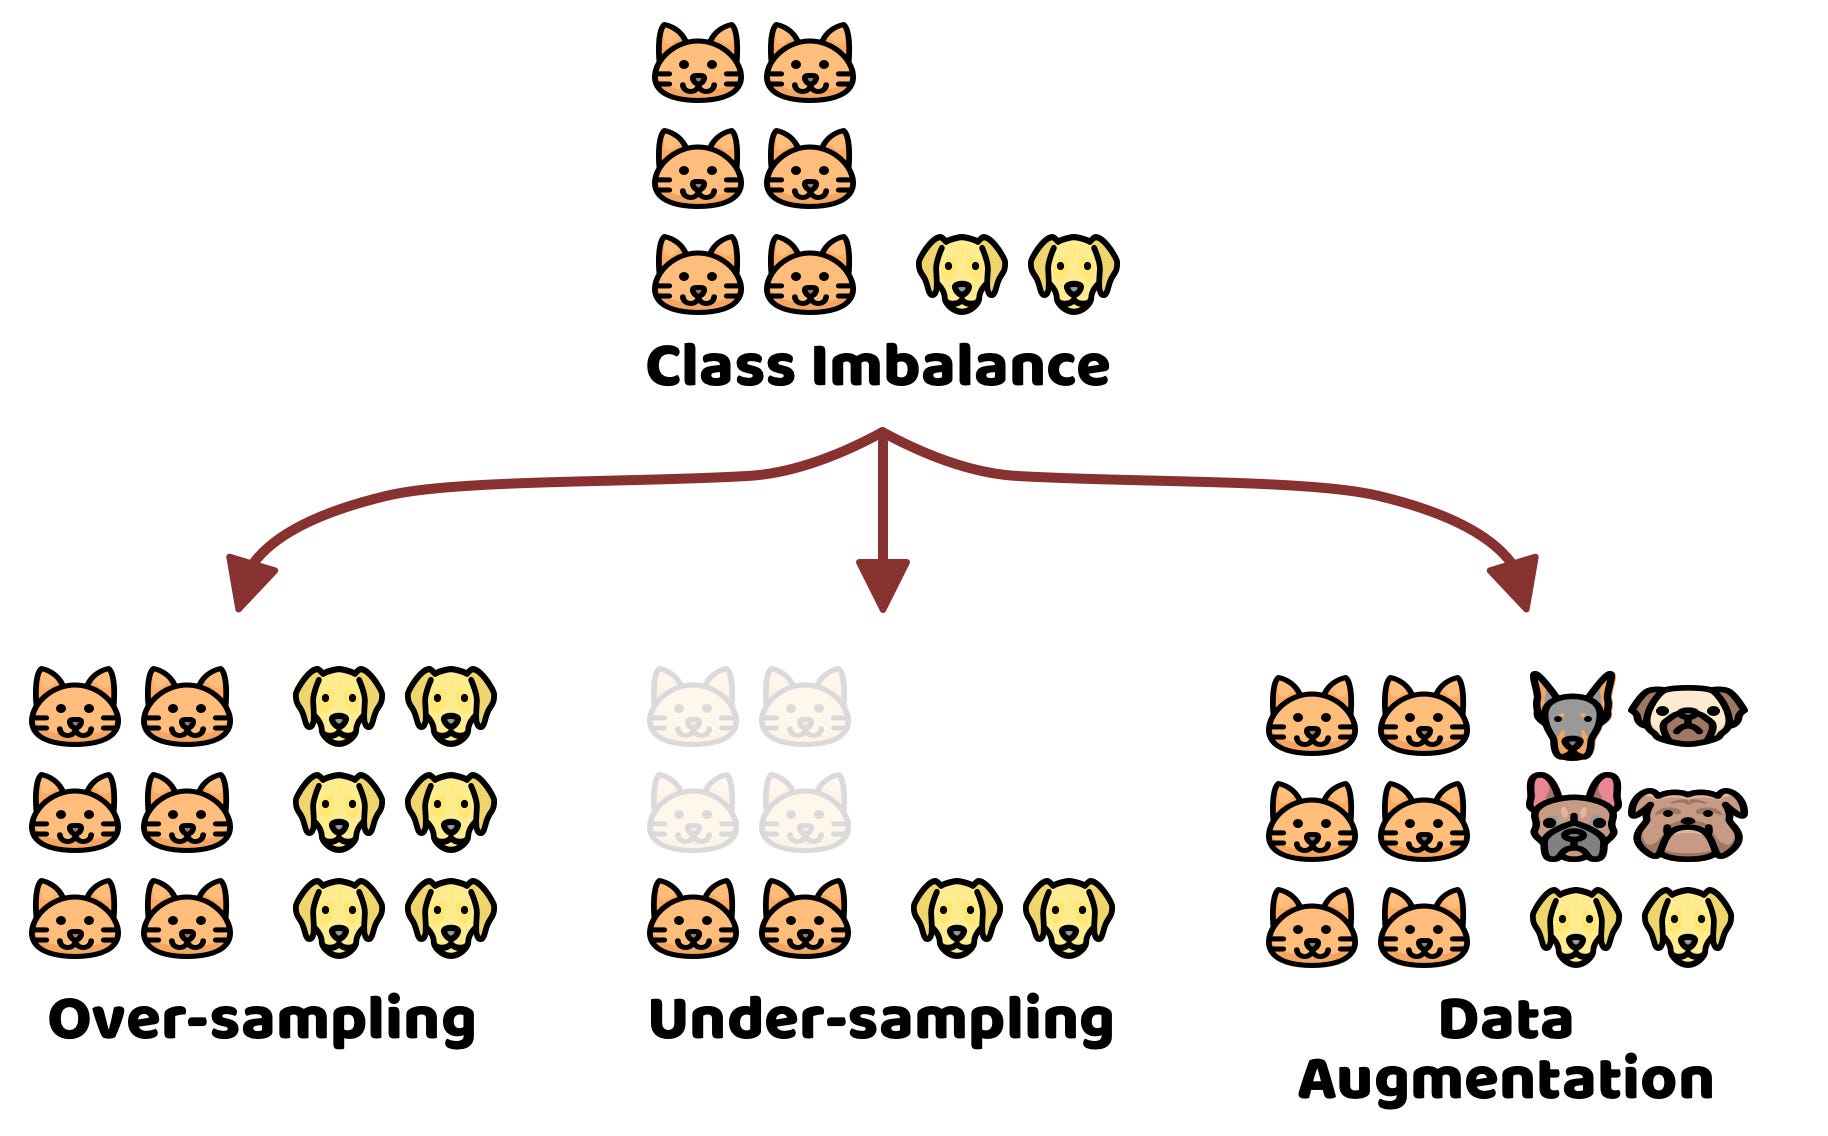
The accuracy trap
Accuracy can be misleading, especially with imbalanced datasets.
 1
1
What to do when accuracies are not acceptable?
- Collect more data or use data augmentation to balance the classes
Dealing with confidence scores
Most models output a confidence score for each prediction/inference. It’s important to choose an appropriate threshold for these scores to balance precision and recall according to your specific use case.
Classification
{label: 'cat', conf: 0.94}
Detection
[{label:'cat', bbox:[x1,y1,x2,y2], conf:0.91}]
Segmentation
mask: ndarray[H,W] of class ids
Dealing with confidence scores (cont.)
🔽 Low threshold (e.g. 0.2)
Accepts many predictions, even uncertain ones.
Use when missing a case is costly (e.g. disease screening)
⚖️ Balanced threshold (e.g. 0.5)
Accepts predictions the model is fairly sure about.
Tune from here based on your use case
🔼 High threshold (e.g. 0.9)
Only accepts very confident predictions.
Use when a false alarm is costly (e.g. automated actions)
☕ Break time!
Let’s take a 10 minute break!
4 · Domain Shift, Transfer Learning & Foundational Models
flowchart TD
    A["Define task ✅"] --> B["Data✅"]
    B --> C[Train✅]
    C --> D[Val✅ and Test✅]
    D --> C
    D --> E[Deploy]
Issues and solutions for real-world deployment
- Domain shift → monitor and adapt
- Transfer learning → leverage pre-trained models
- Foundational models → zero-shot or few-shot with large pre-trained models
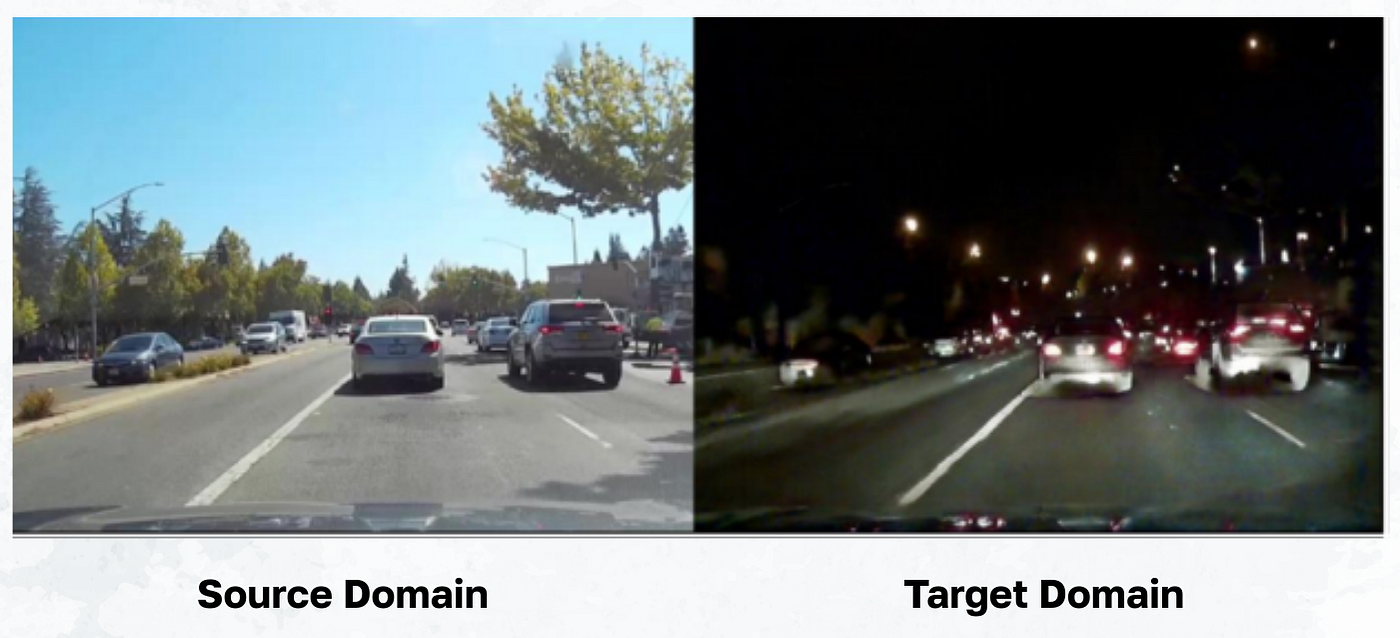
Domain shift: the silent killer of CV projects
Domain shift = when the distribution of data at deployment differs from the distribution at training.
 1
1
Why domain shift is a problem
Models learn patterns in the training data. If the deployment data looks different, those patterns may not hold, leading to poor performance.
To solve this, you need to monitor when domain shift occurs and adapt your model or data collection strategy accordingly.
Transfer learning: a powerful tool to combat domain shift
Can help your model adapt to the new data distribution without needing to train from scratch.
![]() 1
1
Foundational models: the new frontier
Large pre-trained models that can be used for a wide range of tasks with little to no fine-tuning
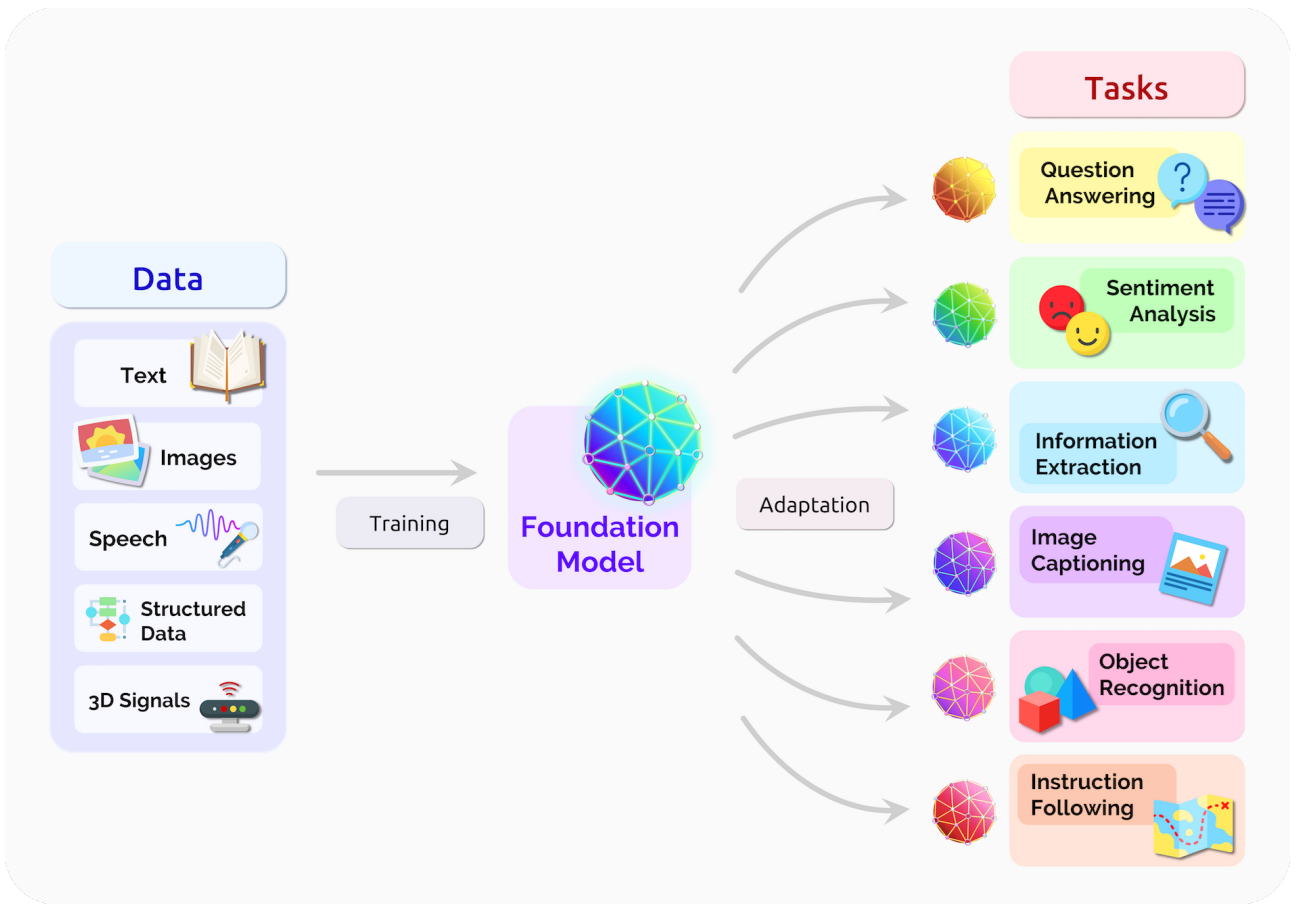
1
5 · Deployment
What “deployment” actually means
Deployment is not just about putting a model in production. It encompasses the entire lifecycle of maintaining and improving a model after it’s been deployed.
Lets display this in Roboflow
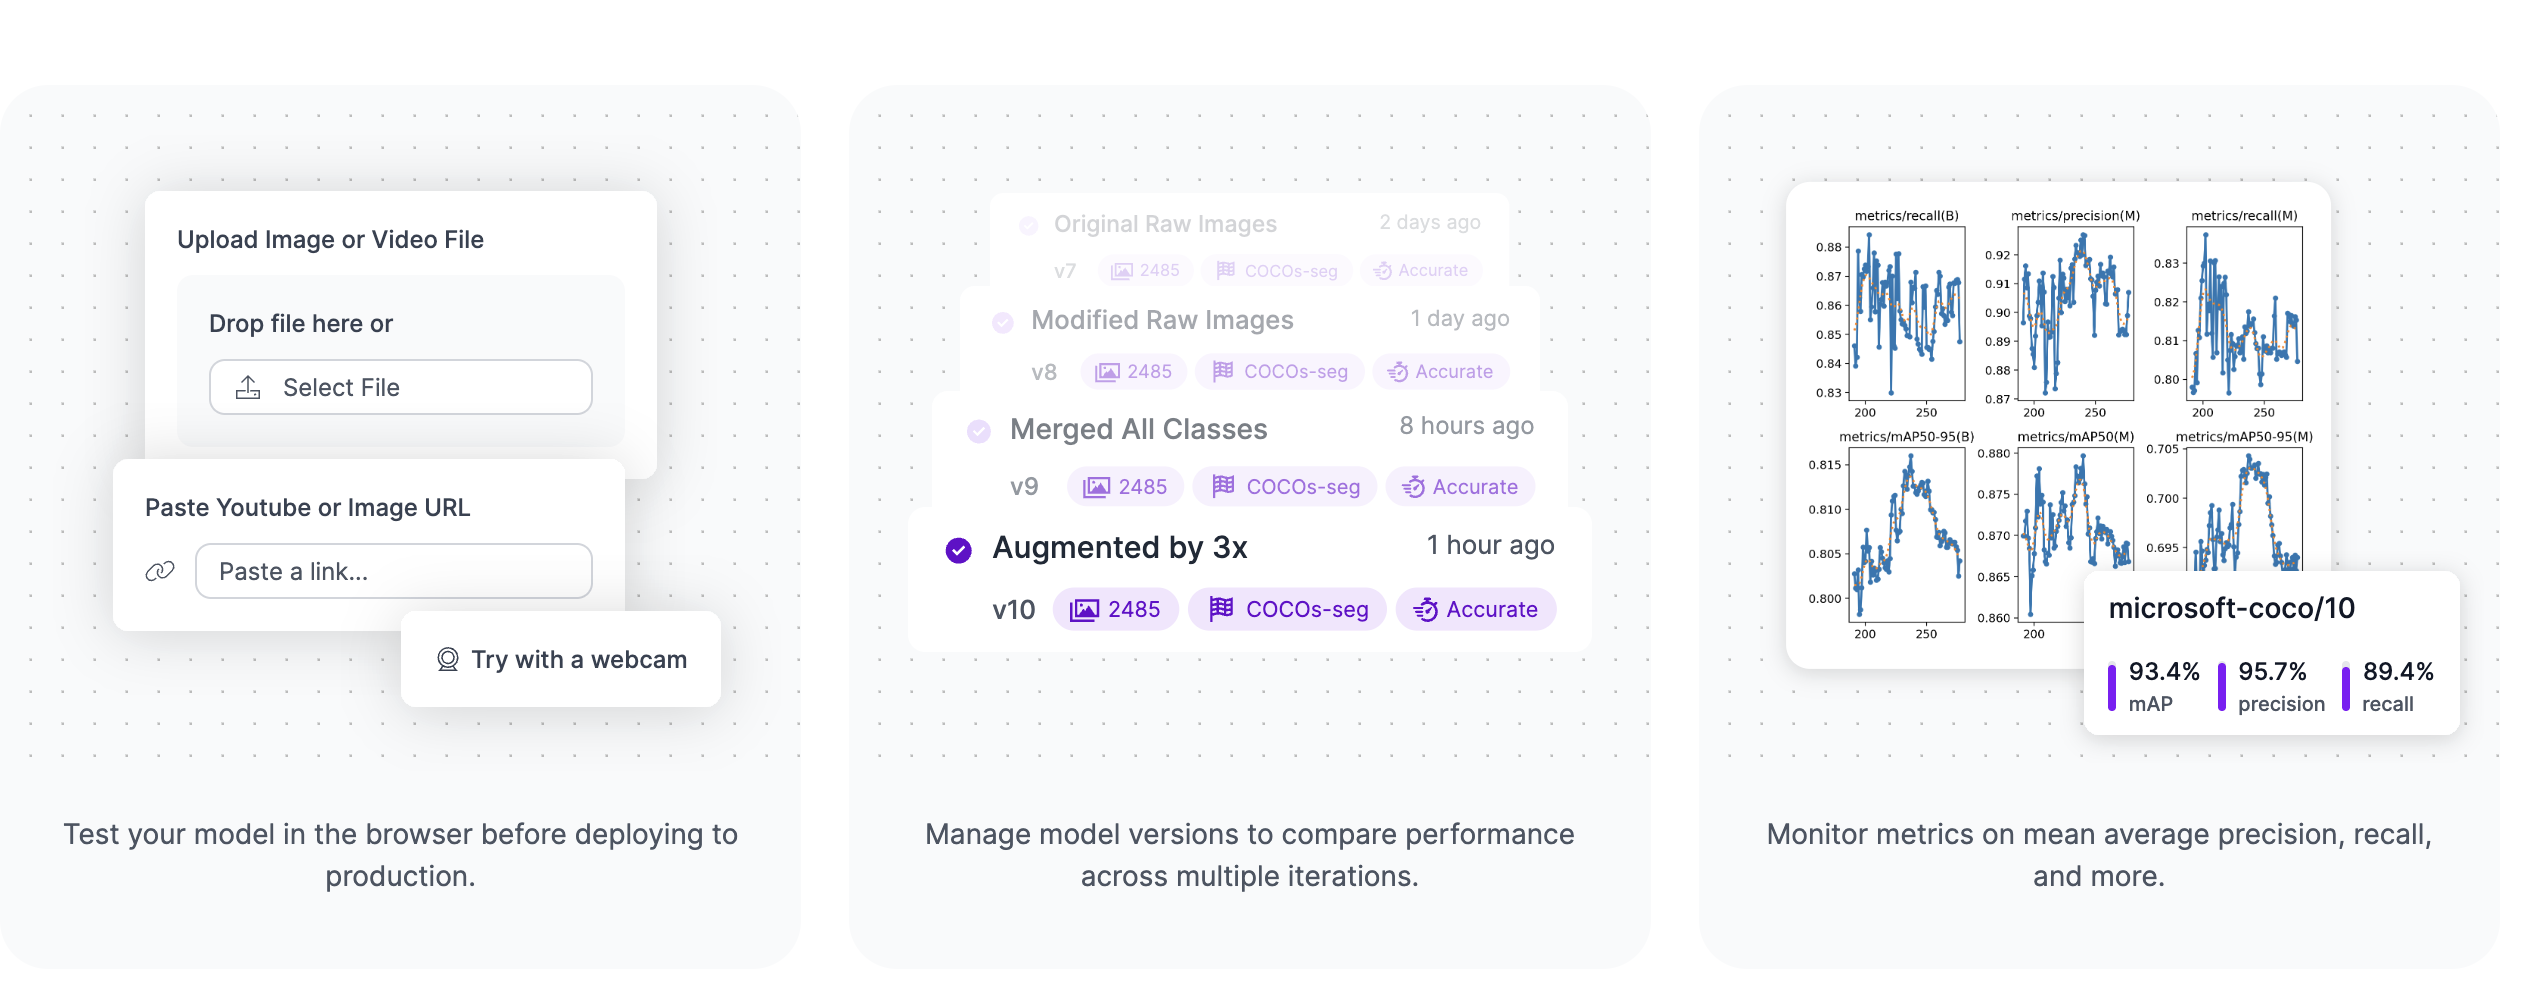
Easy deployment in Roboflow
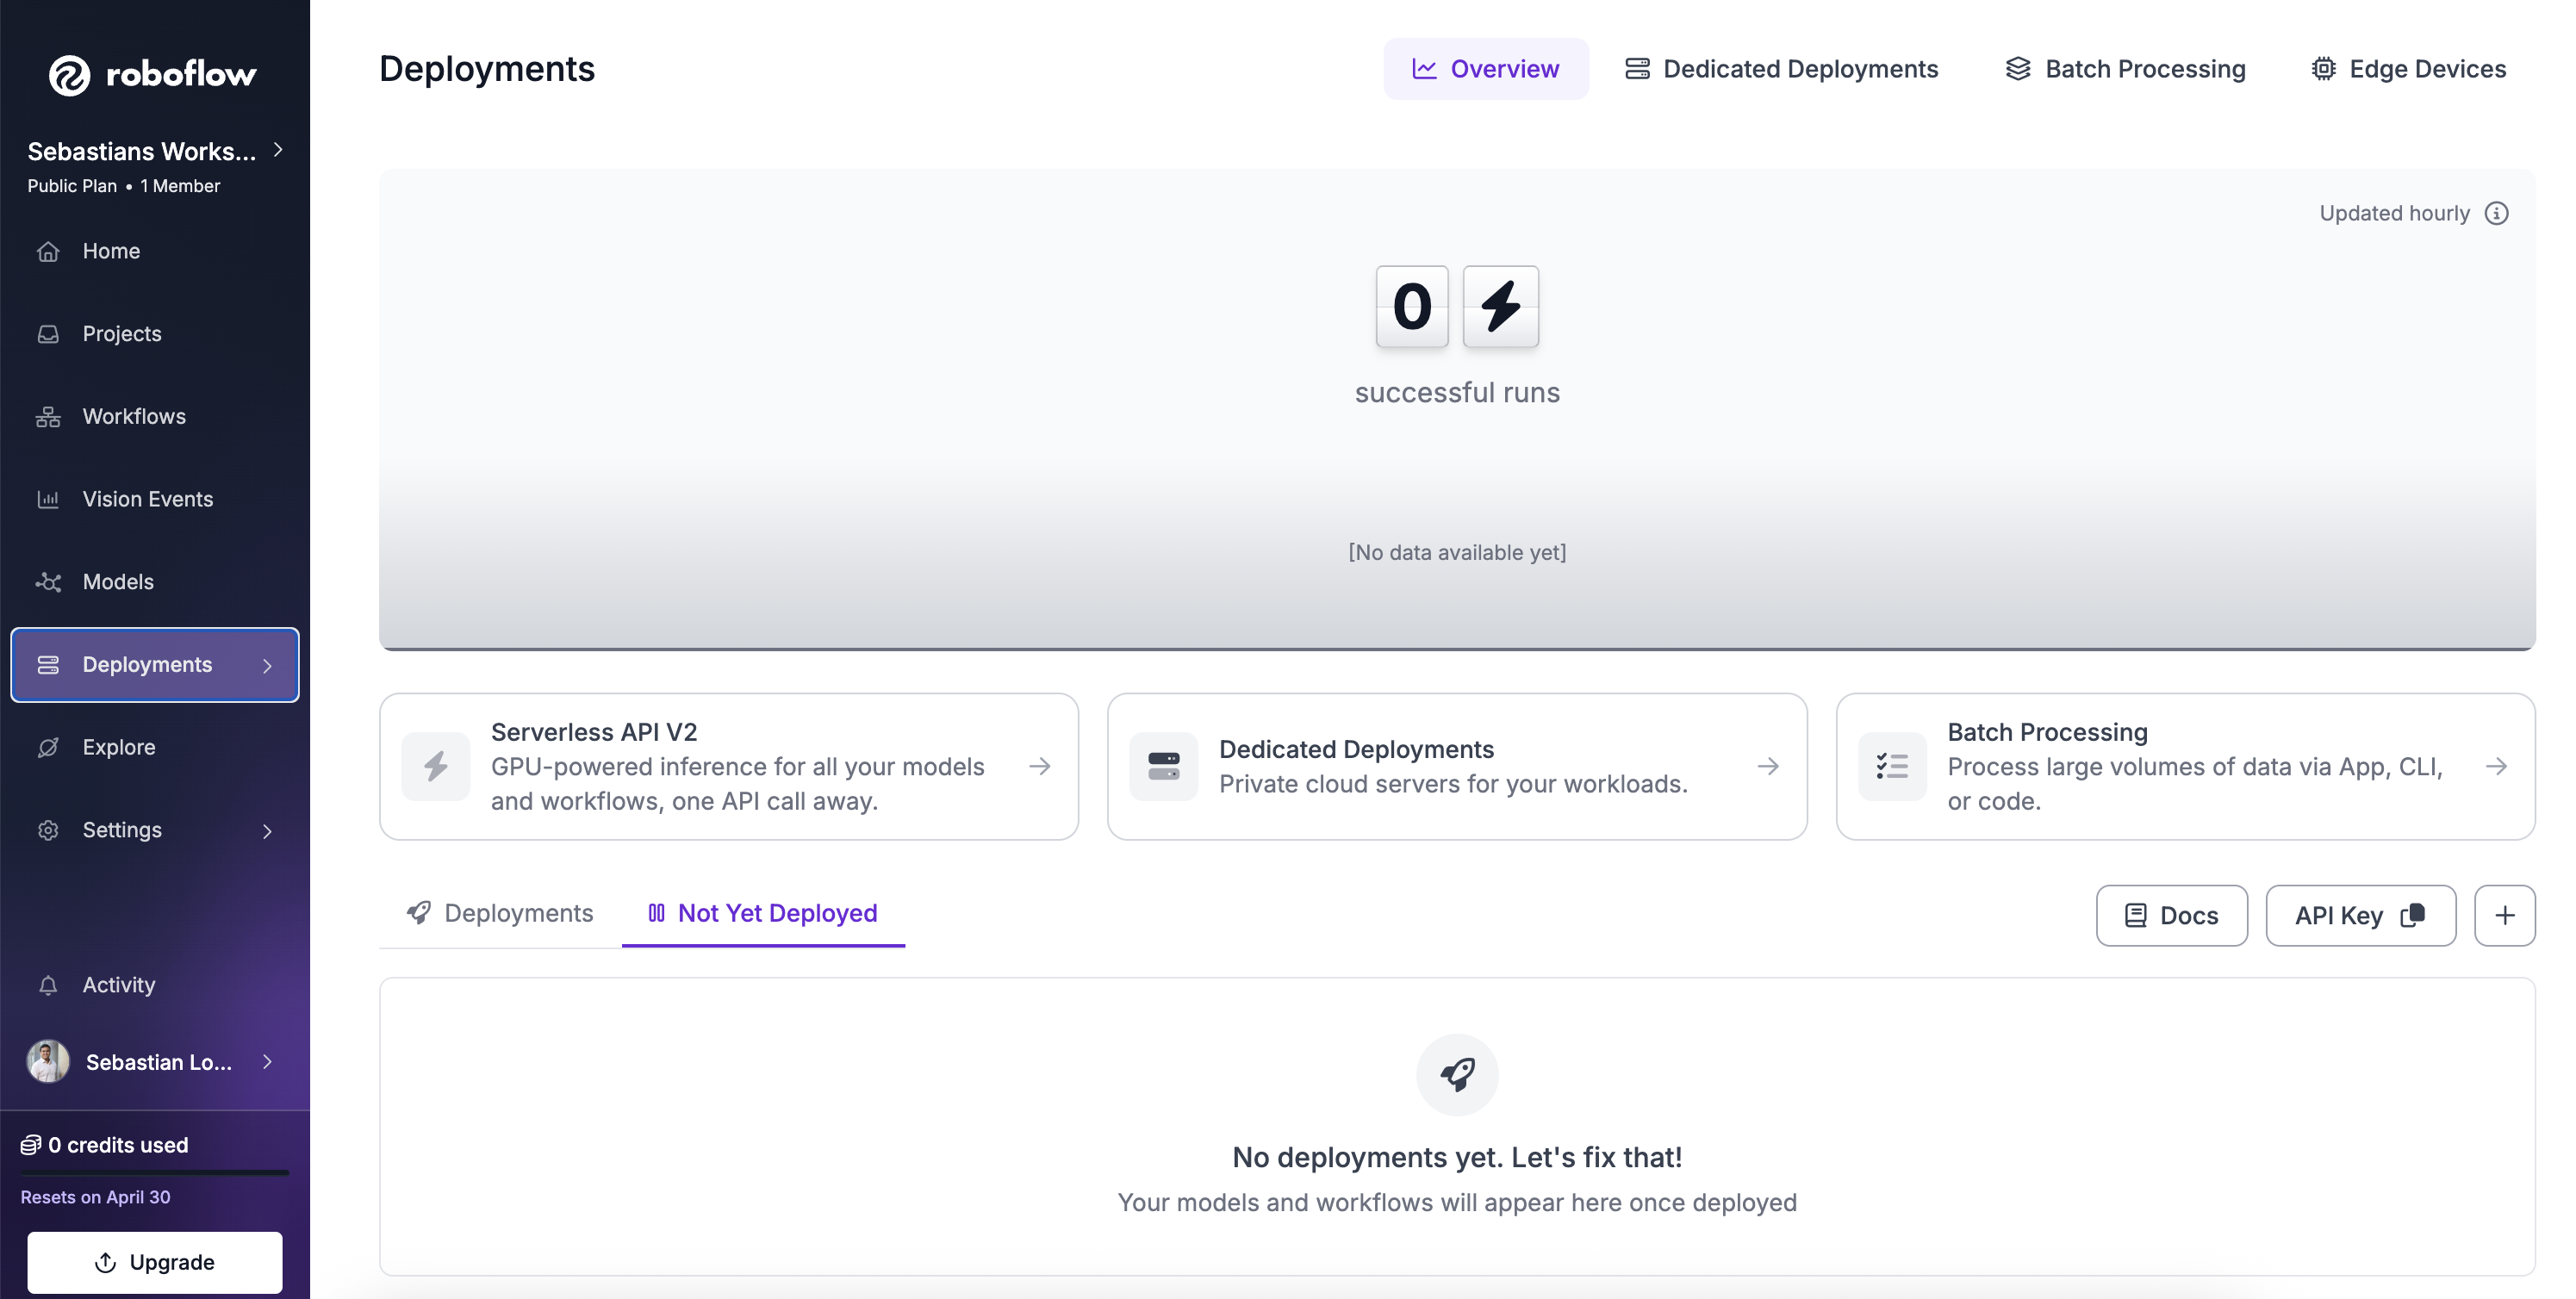
1
6 · Ensembles Models
Ensembles: combining multiple models
- Different models make different mistakes
- Typical gain: +1-5% accuracy, “for free”
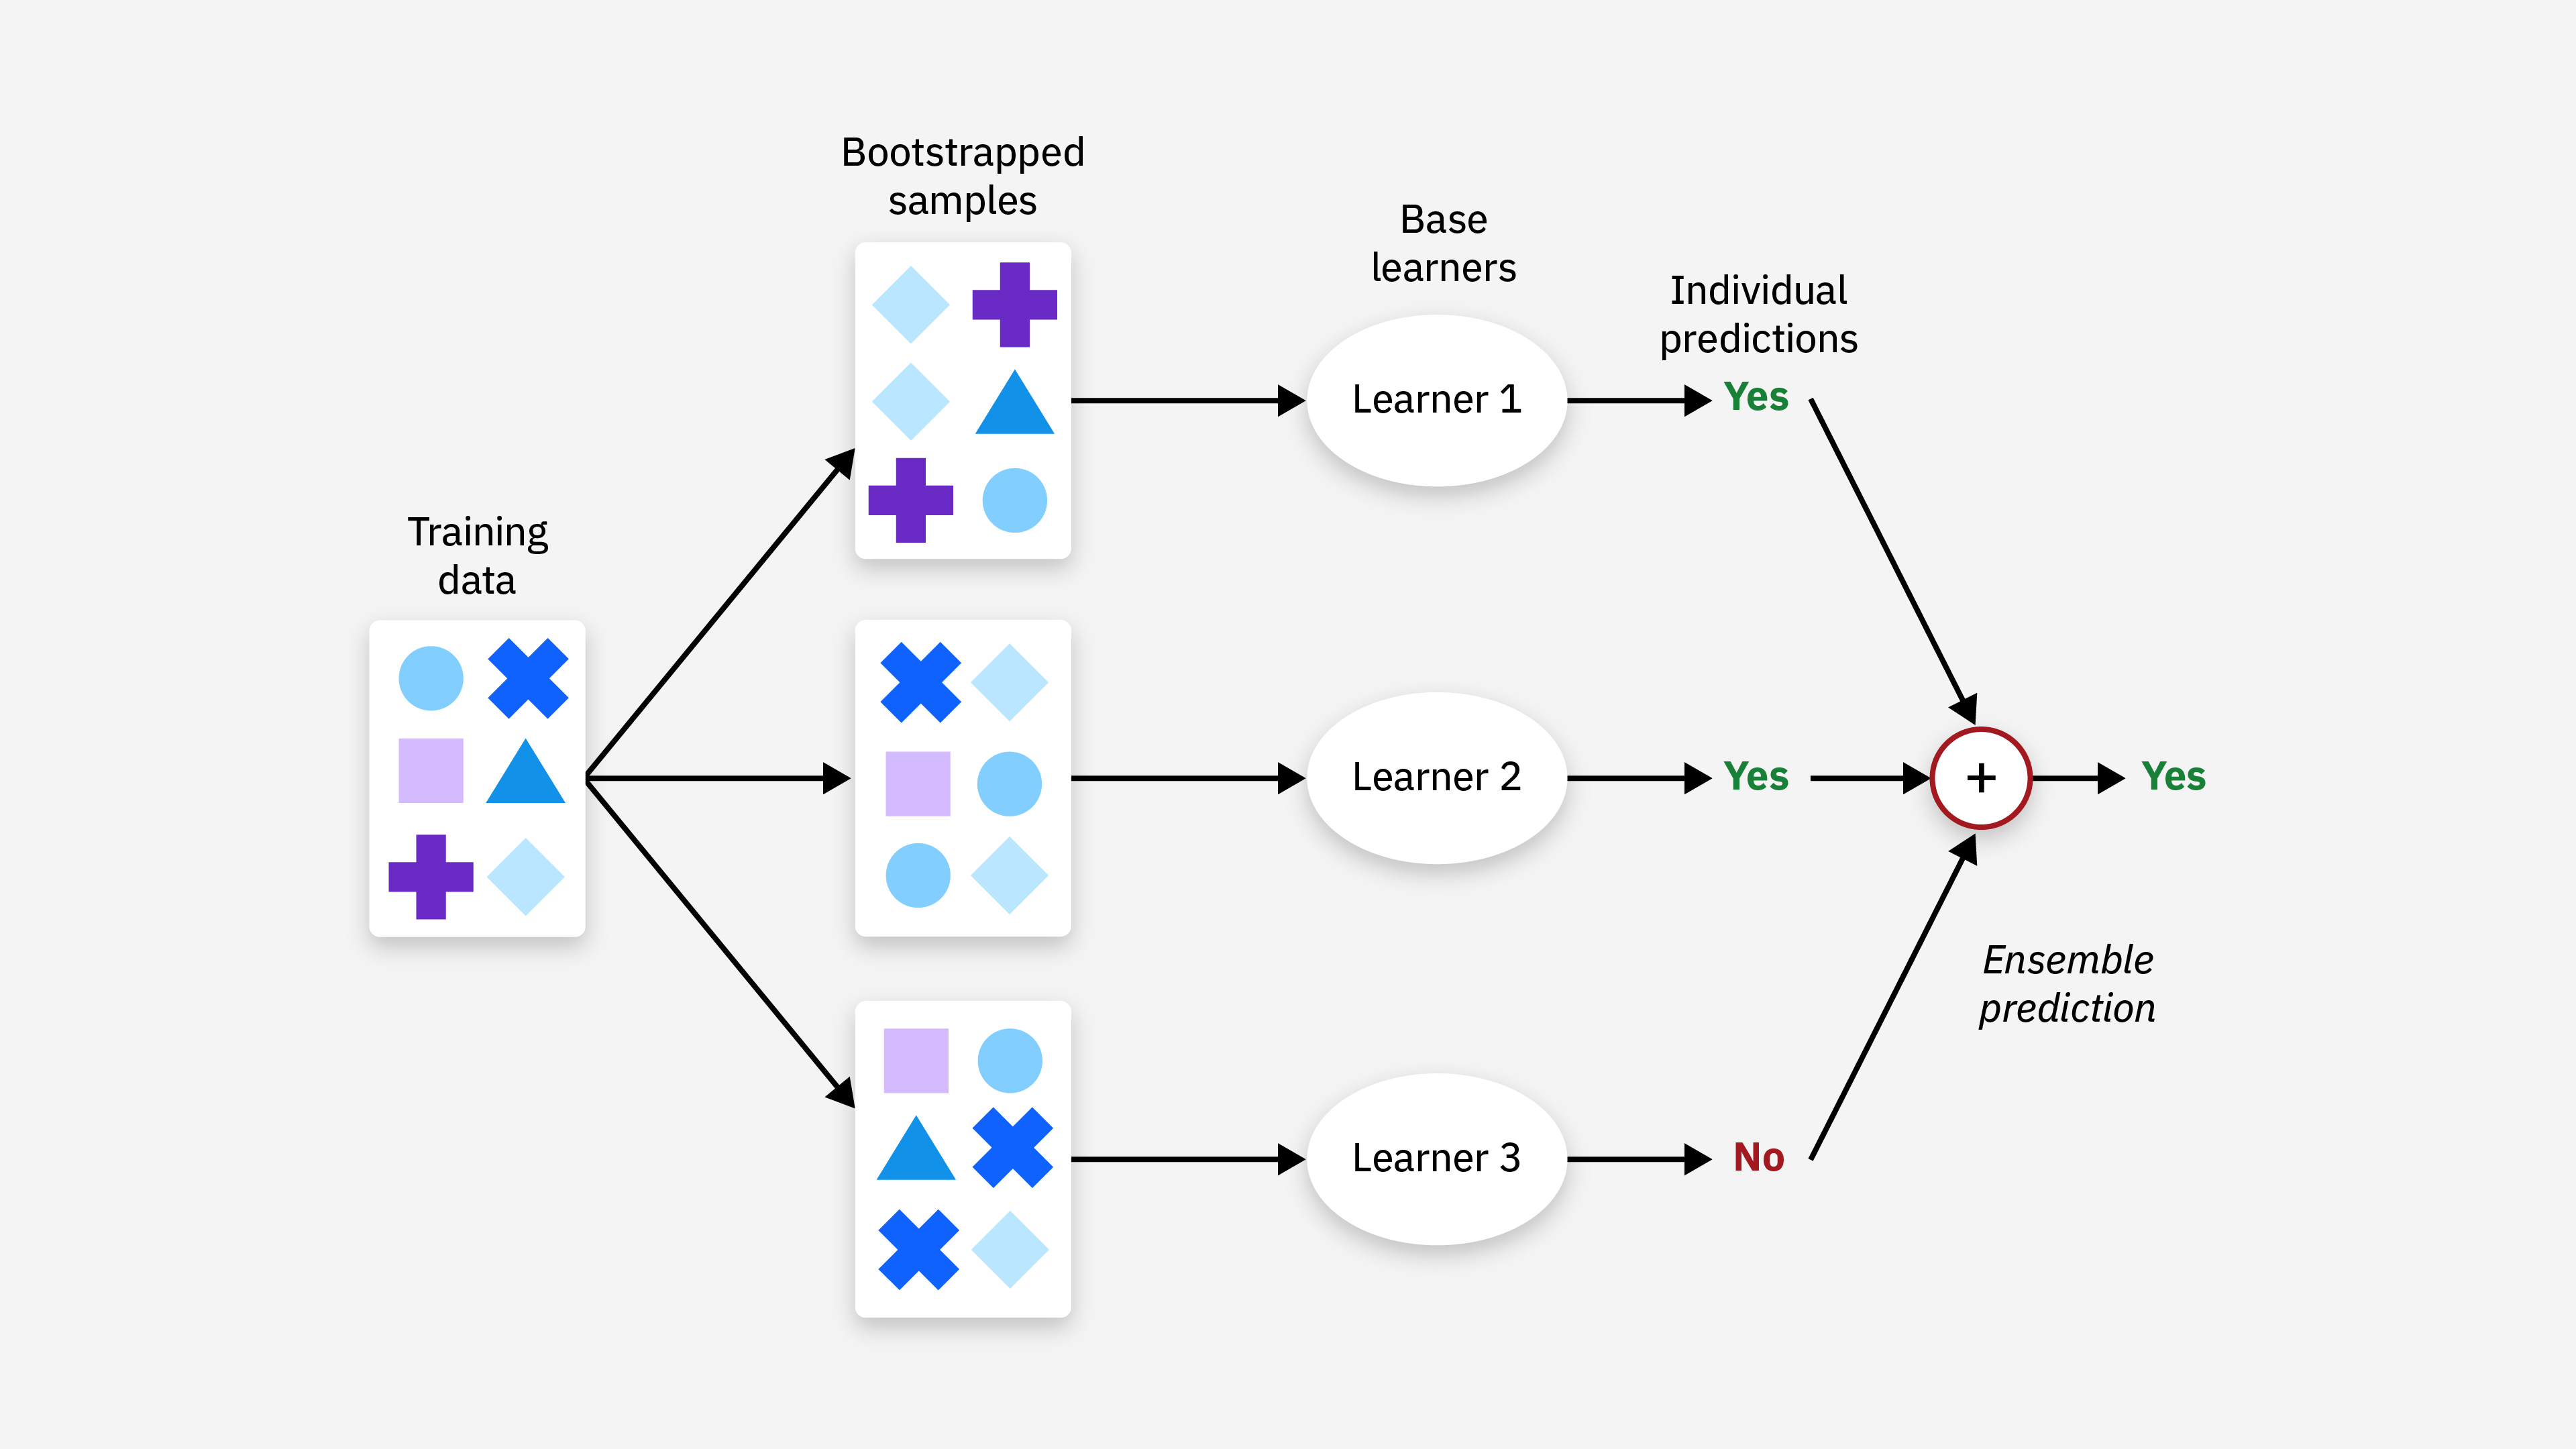
1
7· AI vs Expertise
What can you do yourself — and when do you need help?
For simple use cases, tools like Roboflow can take you a long way: collecting data, labelling, training and basic evaluation are often possible with little code.
When your project moves beyond a prototype, expert support becomes more important.
- App development: building reliable, secure, user-facing software
- Deployment to devices/edge: hardware limits, speed, and model optimisation
- Production systems: scaling, monitoring, maintenance, and reliability
8 · Practical Demos
What we’ll do next (15 min)
- Roboflow Playground (~5 min)
- (https://playground.roboflow.com/object-detection)
- Roboflow Notebooks + Google Colab (~5 min)
- Open a prepared notebook
- Roboflow Universe (~5 min)
- Browse public datasets & models
10 · Support after the workshop
Book a consultation — it’s free
- This workshop includes a 30 min session with me to help you with your specific project.
- We can discuss your project, help you choose the right approach, and even get you started
Thank you 🙏
s.lopezmarcano@uq.edu.au

Easy Image Classification Masterclass · UQ Data Science CRP